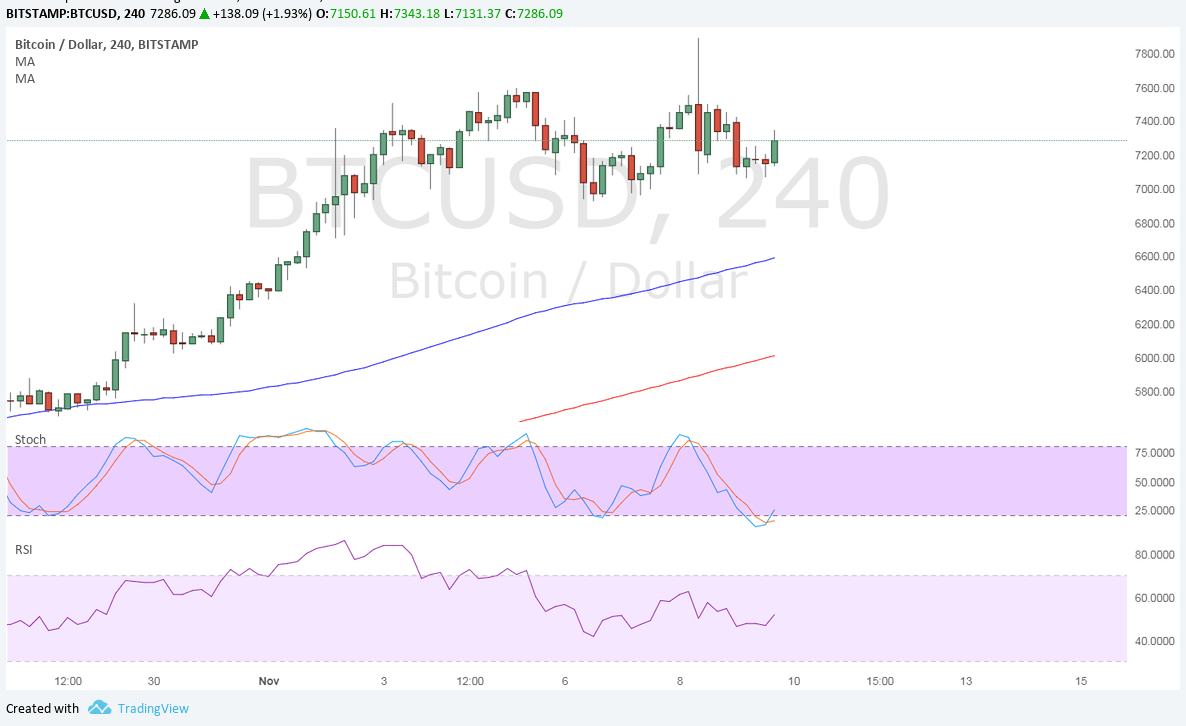
Bitcoin Price Key Highlights
- Bitcoin price had a tough time sustaining its climb after hearing news of the hard fork suspension.
- Price has retreated to its levels before the news broke out, creating a double top pattern.
- This is a classic reversal signal but bitcoin price has to break below the neckline to confirm the drop.
Bitcoin price has formed a classic reversal pattern on its 4-hour time frame as bearish pressure could kick back in.
Technical Indicators Signals
The 100 SMA is still above the longer-term 200 SMA so the path of least resistance is to the upside, which means that there’s a stronger chance for the rally to continue than to reverse.
Stochastic is also pulling up from the oversold region to signal a return in bullish momentum. A bullish divergence is also evident as the oscillator formed lower lows while price had higher lows since November 6.
RSI is treading sideways on middle ground to reflect further consolidation. If it points back down and heads south, bitcoin price might follow suit. The neckline is located around $7000 and the chart pattern is around $1000 tall so the resulting selloff could be of the same height.

Market Factors
There were some signs of relief when the hard fork uncertainty was lifted on the upgrade suspension, but this is still likely to happen at some point in the future. It also leaves the cryptocurrency without the ability to handle more transactions and benefit from the upgrade.
Meanwhile, the dollar is under pressure on setbacks to tax reform. The versions from the House and Senate have huge differences that aren’t likely to be resolved before the end of the year.
Strengthening bitcoin volumes in Japan and South Korea could continue to prop it higher, barring any major issues related to the upgrade or hard fork. Dollar action could still continue to take its cues from tax updates.