Bitcoin Price Key Highlights
- Bitcoin sold off sharply since breaking below the double top pattern highlighted in a previous article.
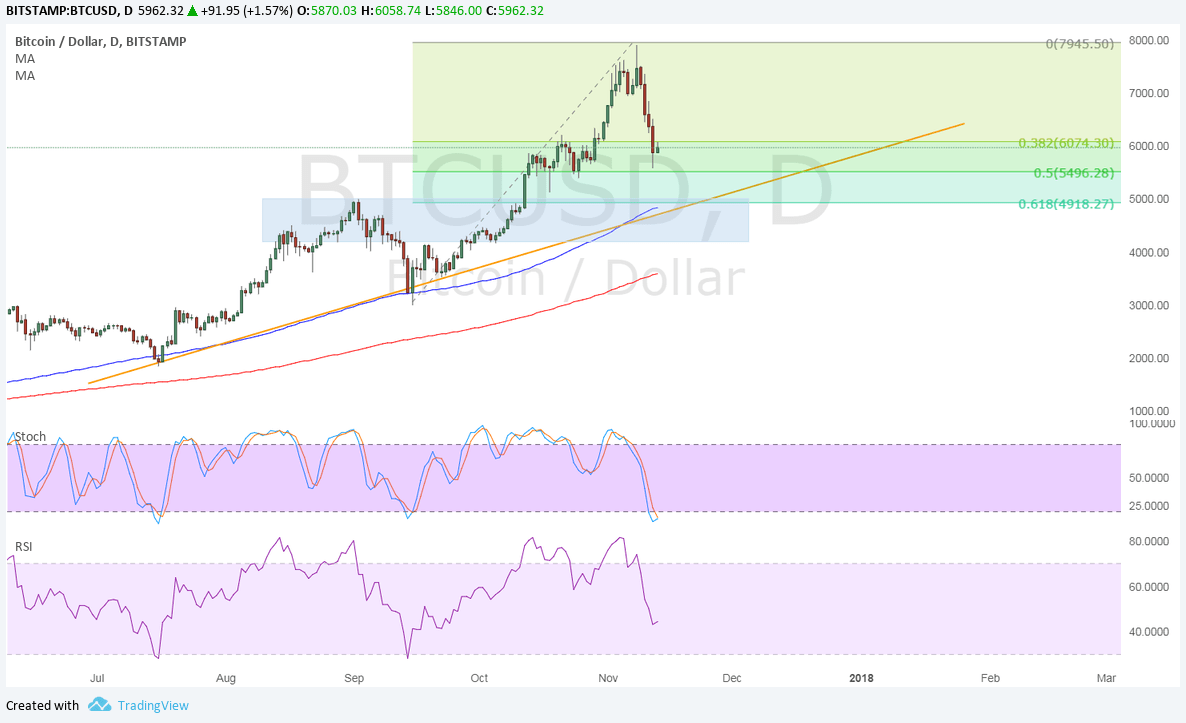
- Zooming out to the longer-term time frame shows that bitcoin price is still in correction mode and is testing the first Fib level.
- This lines up with a short-term area of interest but a deeper correction could find its way to the rising trend line on the daily chart.
Bitcoin price is in the middle of a much-needed correction from its strong rally since mid-September but technical indicators suggest that the uptrend could resume soon.
Technical Indicators Signals
The 100 SMA is still above the longer-term 200 SMA on the daily time frame so the path of least resistance is to the upside, which means that the uptrend would resume at some point.
In addition, the gap between the moving averages is widening to reflect strengthening bullish momentum. The 100 SMA coincides with the rising trend line connecting the lows of bitcoin price action since mid-July, adding to its strength as a floor.
It also lines up with the 61.8% Fibonacci retracement level around the $5000 handle. To top it off, it is around the former resistance level that might now hold as support, so plenty of buy orders are likely waiting there.
Stochastic is on the move down but dipping into oversold territory, which reflects exhaustion among sellers. RSI has more room to fall, though, so bearish pressure could stay in play until this oscillator hits oversold levels and turns back up.
If bullish pressure returns at any of the Fibs, bitcoin price could resume its climb to the swing high and beyond. On the other hand, a move below the trend line and 61.8% Fib could mark the start of a long-term reversal.

Market Factors
Bitcoin price popped higher on news that the hard fork this month is suspended, but this scenario is bound to come up again sooner or later, which means that the uncertainty has simply been postponed and not avoided.
Meanwhile, the dollar is also under pressure on more challenges to achieving tax reform, but it looks like it is able to hold a candle against the massive profit-taking in bitcoin longs.