Bitcoin Price Key Highlights
- Bitcoin price recently broke below an area of interest marked in an earlier article, indicating that a downtrend might be due.
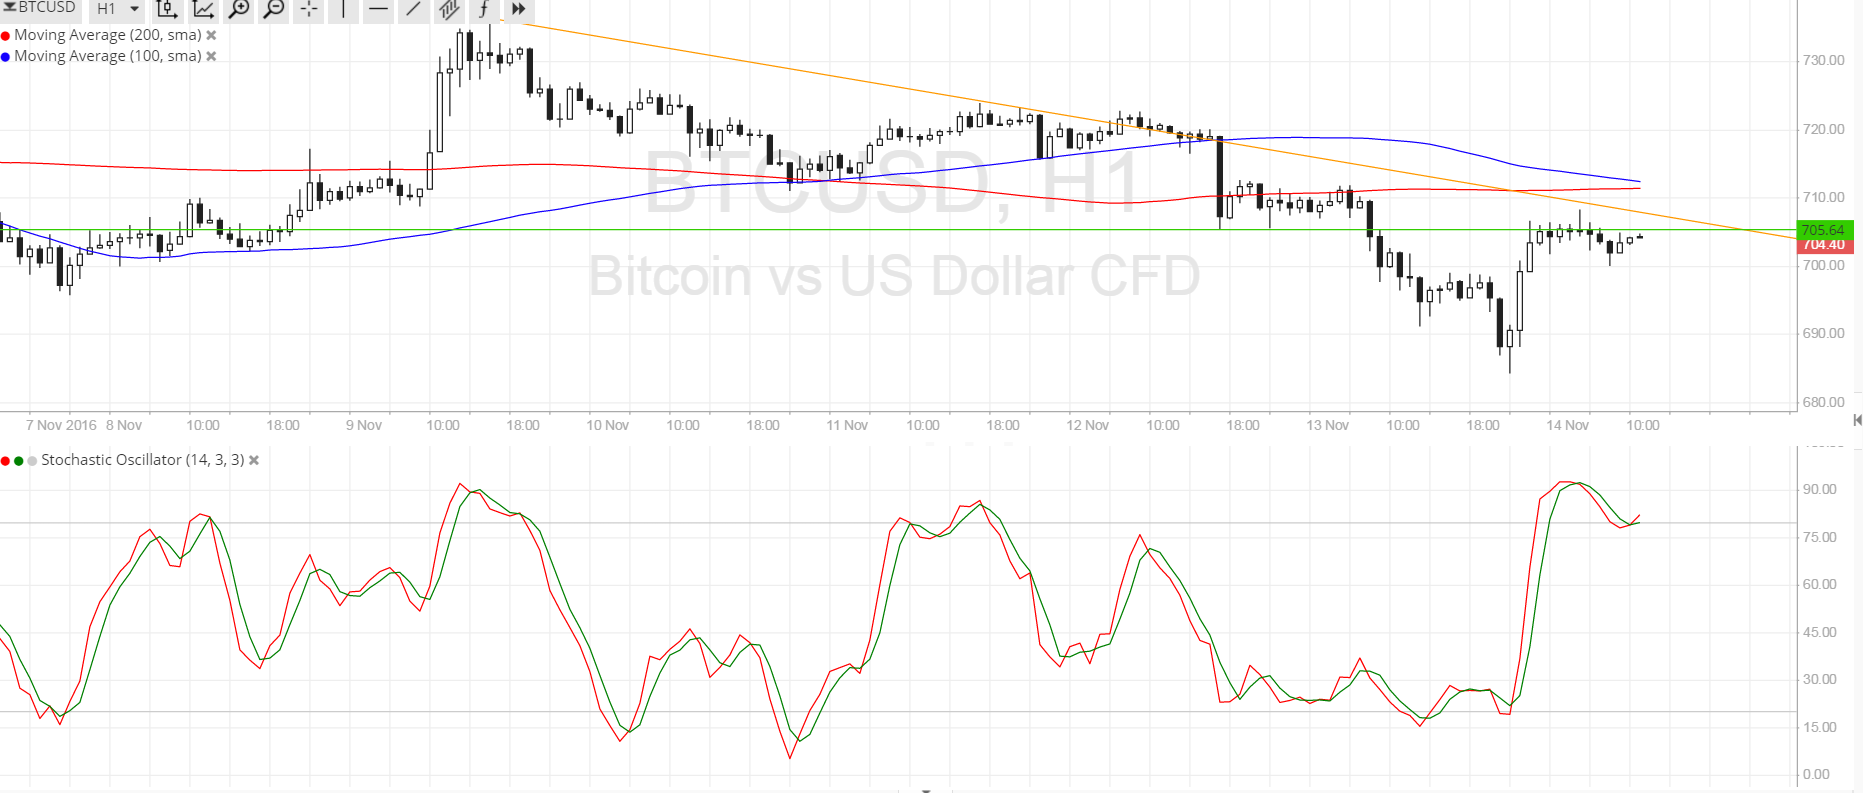
- Price is now pulling back up to this area for a retest before gaining more traction in its selloff.
- If the near-term resistance holds, bitcoin price could make its way back down to the recent lows at $685.
Bitcoin price is establishing a new downtrend after breaking below an area of interest. More bears are waiting at this retest of the broken support.
Technical Indicators Signals
The 100 SMA is still above the 200 SMA for now but the gap has considerably narrowed, indicating that a downward crossover is in the works. If that materializes, selling pressure could kick higher, allowing bitcoin price to resume its selloff.
Also, the moving averages line up with the descending trend line connecting the highs of bitcoin price action since November 9, adding to its strength as a potential ceiling around $705-710. A move past this area could put bitcoin back in its longer-term climb.
Lastly, stochastic is indicating overbought conditions and is starting to turn lower. This means that buying momentum is exhausted and that sellers could hop back in.

Market Events
The US dollar has been on a tear since the election results were announced, as a bit of calm was restored in the markets when president-elect Trump gave a relatively sober victory speech. Market watchers are now focusing their attention to his campaign promises of corporate tax cuts, bank deregulation, and an overhaul of the healthcare system, all of which might benefit businesses down the line.
Apart from that, the selloff in bitcoin against other currencies, mainly the Chinese yuan, has led to cryptocurrency losses across the board. On top of rumors that the Chinese government could restrict bitcoin trading in the mainland, the yuan’s recent appreciation has been drawing more investor interest in Chinese assets.
Moving forward, continued optimism in the US economy and reinforced expectations of a Fed rate hike this December could keep the dollar rallying against bitcoin. US retail sales, PPI, CPI and a speech by Fed head Yellen are lined up this week.
Charts from SimpleFX