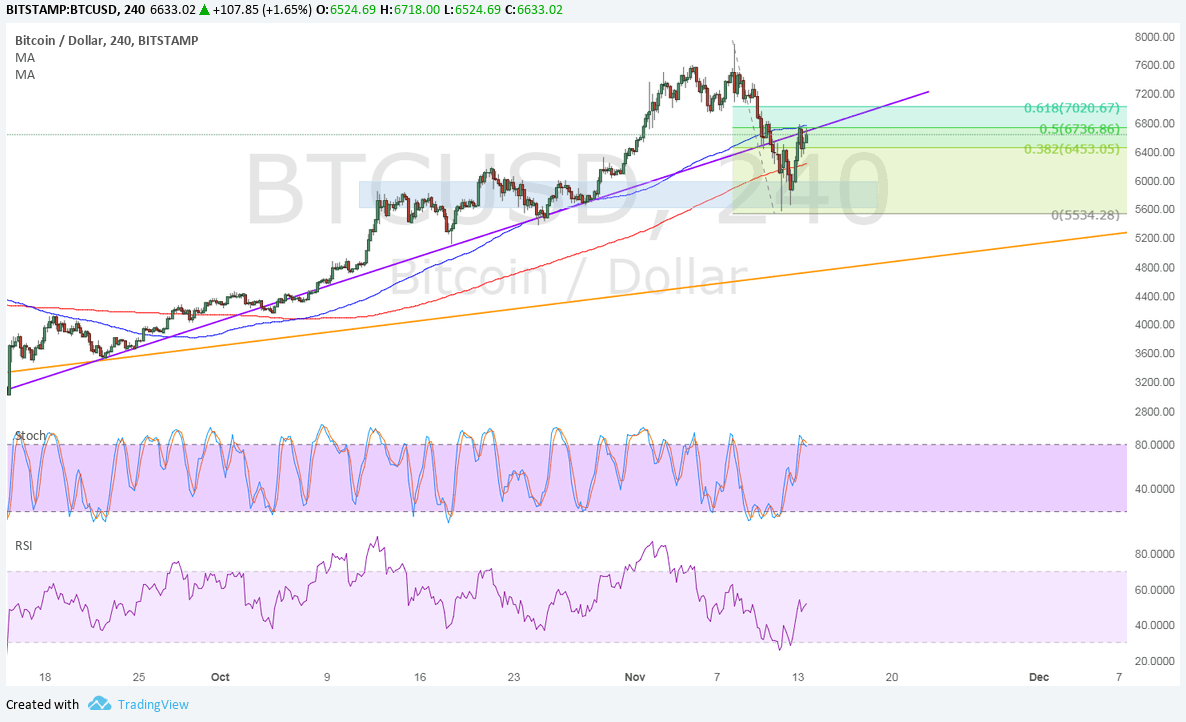
Bitcoin Price Key Highlights
- Bitcoin price recently broke below a short-term ascending trend line and is pulling up for a retest.
- This broken support lines up with the 50% Fibonacci retracement level and could hold as resistance.
- If so, bitcoin price could resume its slide to the longer-term ascending trend line around $5000.
Bitcoin price has bounced off a near-term area of interest but the broken short-term trend line is holding as a ceiling at the moment.
Technical Indicators Signals
The 100 SMA is still above the longer-term 200 SMA on this time frame, so the path of least resistance is to the upside. However, the 100 SMA also appears to be holding as dynamic resistance around the 50% Fib and the broken trend line support.
If this continues to keep gains in check, bitcoin price could resume its slide to the swing low at $5500 or until the longer-term rising trend line support around $4800-5200.
RSI is moving higher and has plenty of room to climb, indicating that bullish pressure could stay in play for a while. In that case, bitcoin price could move back above the short-term trend line and revisit the record highs.
However, stochastic is already hitting overbought levels and looks ready to turn lower to reflect a pickup in selling pressure. A move back below the 200 SMA or $6000 area of interest could confirm that bearish momentum is setting in.

Market Factors
Traders seem to have taken the chance to buy bitcoin at cheaper levels after the selloff that ensued on the hard fork suspension. The dollar is still being pushed around by tax reform updates, and the outcome of the House vote on their version of the bill could set the tone for its movement for the next few days.
Apart from that, US CPI and retail sales are due later in the week, with today’s PPI numbers likely providing a preview. As for bitcoin itself, rival version bitcoin gold is already live and might pose stiff competition for the original one, although some have remarked that the launch has been a bumpy one.