Bitcoin Price Technical Analysis
- Bitcoin price halted its sharp drop yesterday, bouncing off the ascending channel support illustrated in the previous post.
- Buyers seem to be getting back in the game at that point, possibly yielding another climb back to the resistance at $780.
- Technical indicators are giving mixed signals for now so a breakdown might still be possible.
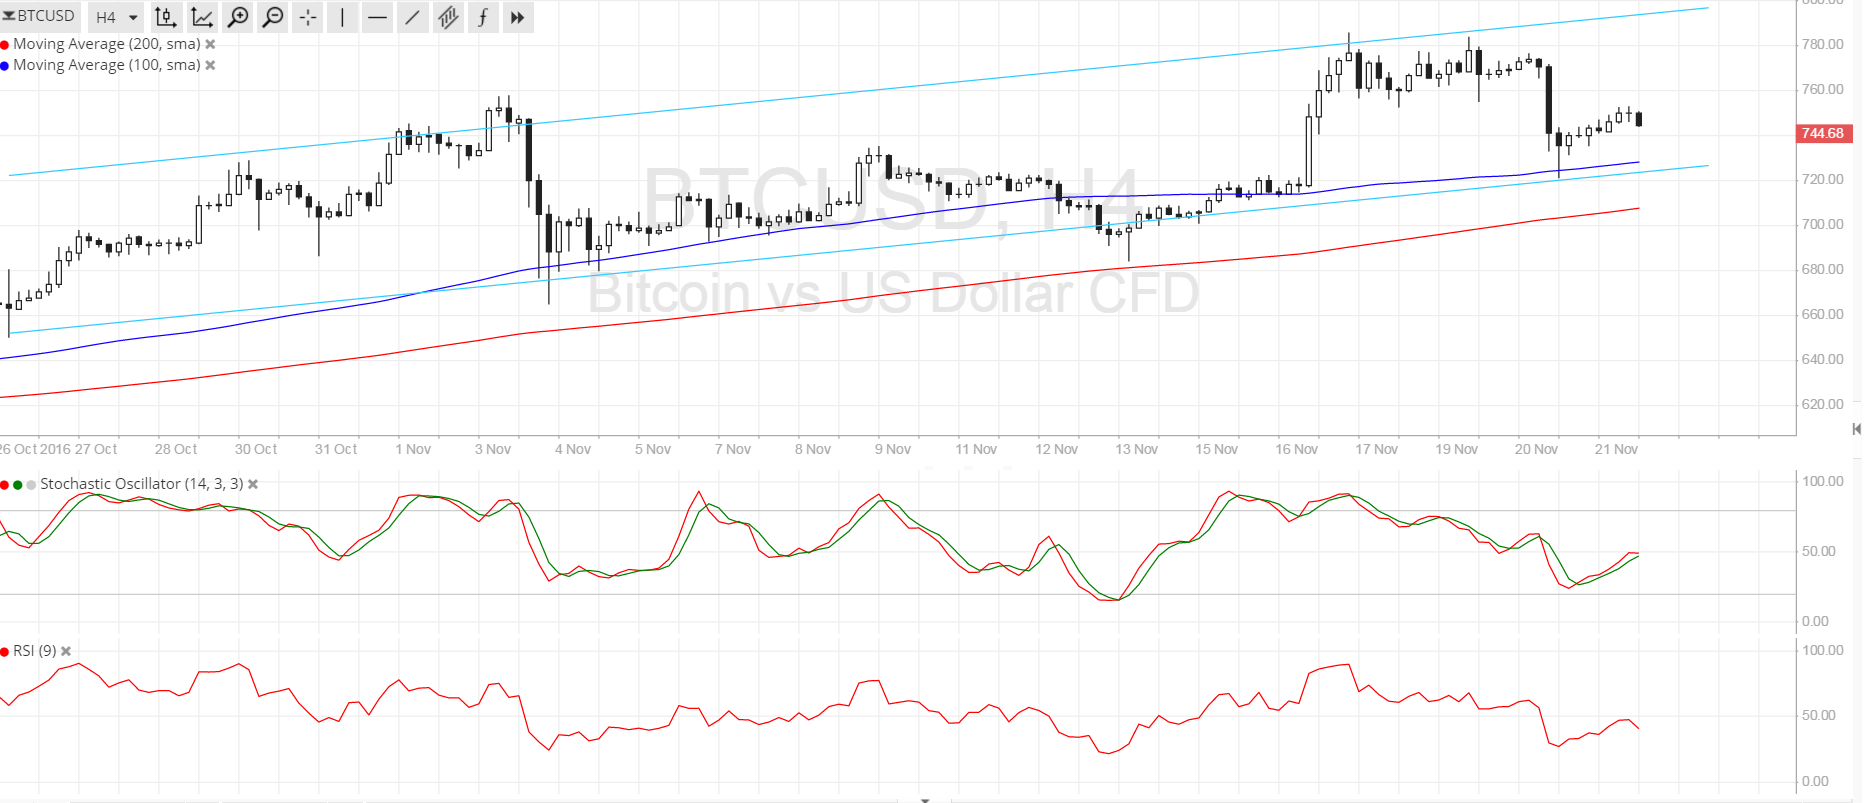
Bitcoin price found support at the bottom of its ascending channel visible on the 4-hour time frame, but buying pressure seems weak.
Technical Indicators Signals
The 100 SMA is above the longer-term 200 SMA so the path of least resistance is to the upside. The short-term MA lines up with the bottom of the channel, adding to its strength as a floor, but a larger dip to the 200 SMA dynamic support might still be possible.
Stochastic is on its way up so bitcoin price could follow suit, making another attempt at breaking past the highs at $780 and creating new ones closer to $800. However, RSI is on the move down to show that bearish momentum is in play. This could lead to another test of the channel support, depending on how strong sellers get. A break below the 200 SMA could spur a drop to the next area of interest at $650.

Market Events
Both bitcoin price and the US dollar are enjoying strong upside pressures at the moment, with bitcoin supported by inflows from China due to the government’s efforts to weaken the yuan and the dollar boosted by strengthening odds of a Fed interest rate hike in December.
FOMC minutes are up for release this week and this should remind traders that the dollar is poised to enjoy stronger demand in the coming weeks, possibly providing bears enough energy to push BTCUSD lower. Still, increased hedging activity by Chinese investors against yuan-denominated holdings could be enough to keep bitcoin price afloat across the board.
Tight price action could be seen in the next few days as these factors clash but volatility is highly expected to surge by Thursday when US traders take off for their Thanksgiving holidays. Profit-taking activity could lead to more bitcoin price dips, but this might draw more buyers in at better levels.
Charts from SimpleFX