Bitcoin Price Key Highlights
- Bitcoin price is still trending higher on its 4-hour chart and moving inside the ascending channel previously marked.
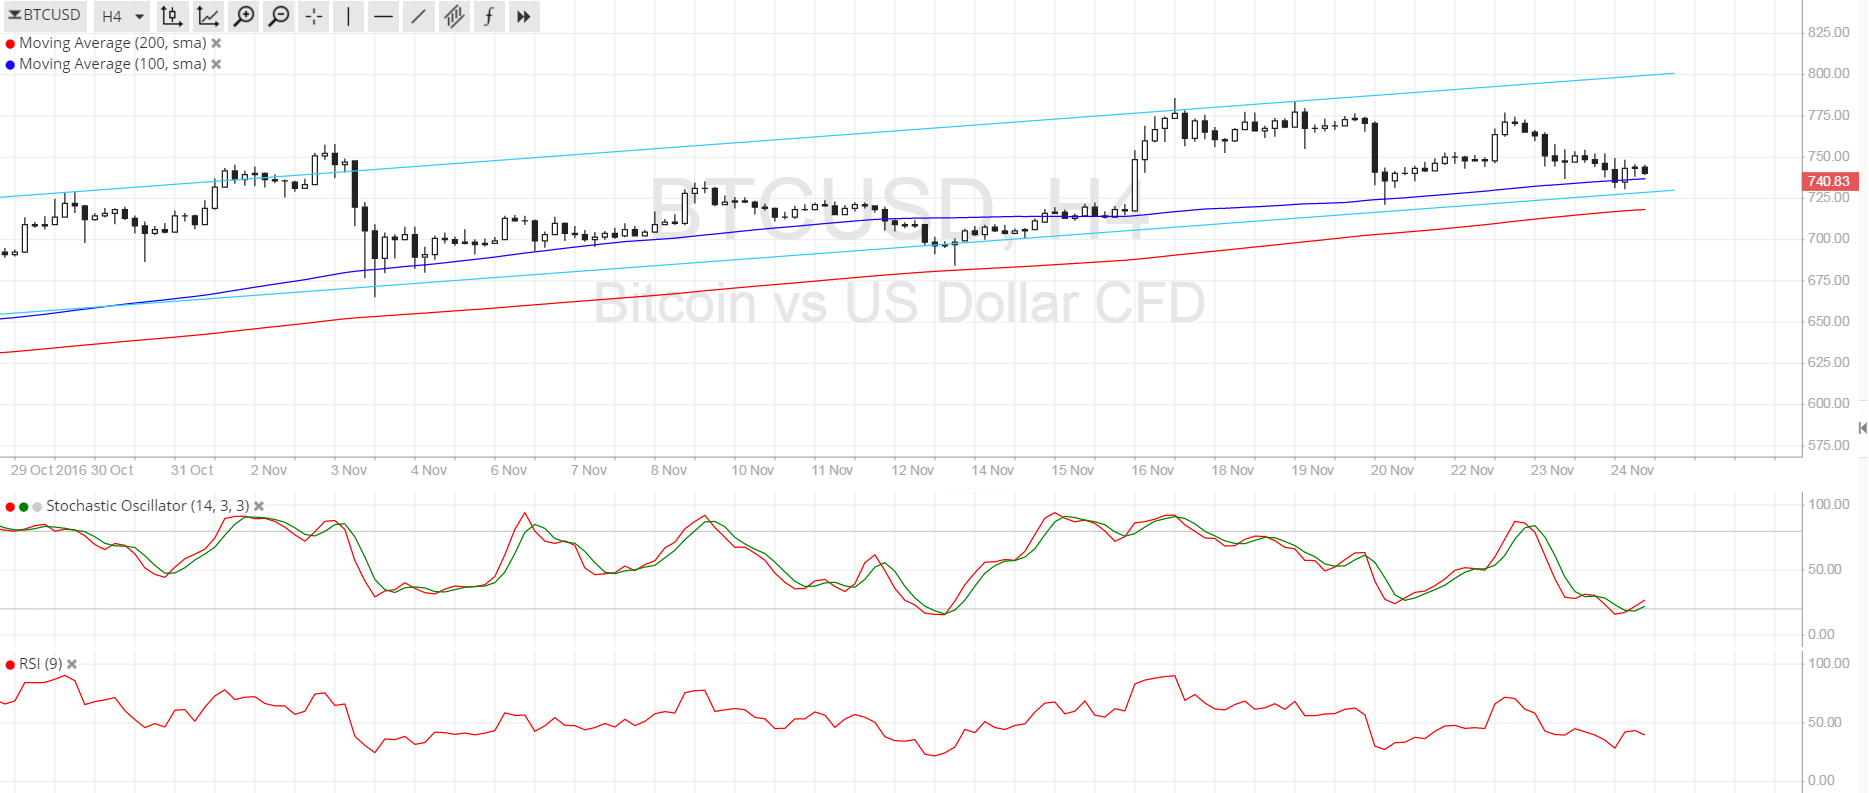
- Price has pulled all the way back to the channel support around $740-745 after previously testing the yearly highs.
- There are several inflection points at this support zone so a bounce could be due, and technical indicators are suggesting that buyers are about to return.
Bitcoin price is testing the ascending channel support visible on the 4-hour time frame and could be gearing up for another rally.
Technical Indicators Signals
The 100 SMA is above the longer-term 200 SMA on this time frame, confirming that the path of least resistance is to the upside and that the climb could resume. In addition, the 100 SMA lines up with the channel support, adding to its strength as a floor.
Stochastic is already in the oversold area and is starting to turn higher, possibly indicating a return in bullish pressure. Meanwhile, RSI is still treading lower to show that there’s bearish momentum left and might be enough to push bitcoin price to test the 200 SMA dynamic support on a larger correction.
Stronger selling pressure could trigger a downside break of support and a move towards the next area of interest at $680-700. However, it would need a huge market catalyst to trigger such a move, either stemming from the US, China, or the bitcoin industry itself.

Market Events
Another factor that’s keeping bitcoin price afloat these days is the pickup in interest from India, which is another potentially huge market. Word is that monetary authorities are looking into restrictions for gold trading and rupee action so investors are seeking to make investments elsewhere, with the cryptocurrency offering tempting returns.
This underscores the renewed interest in bitcoin among Chinese investors who are seeking to hedge against their eroding yuan-denominated returns due to the government’s efforts to devalue the currency. Meanwhile, the US dollar continues to bank on Fed rate hike expectations but growing market interest in bitcoin could outweigh these already priced-in speculations and allow the cryptocurrency to hold on to its recent gains.
Charts from SimpleFX