Bitcoin Price Key Highlights
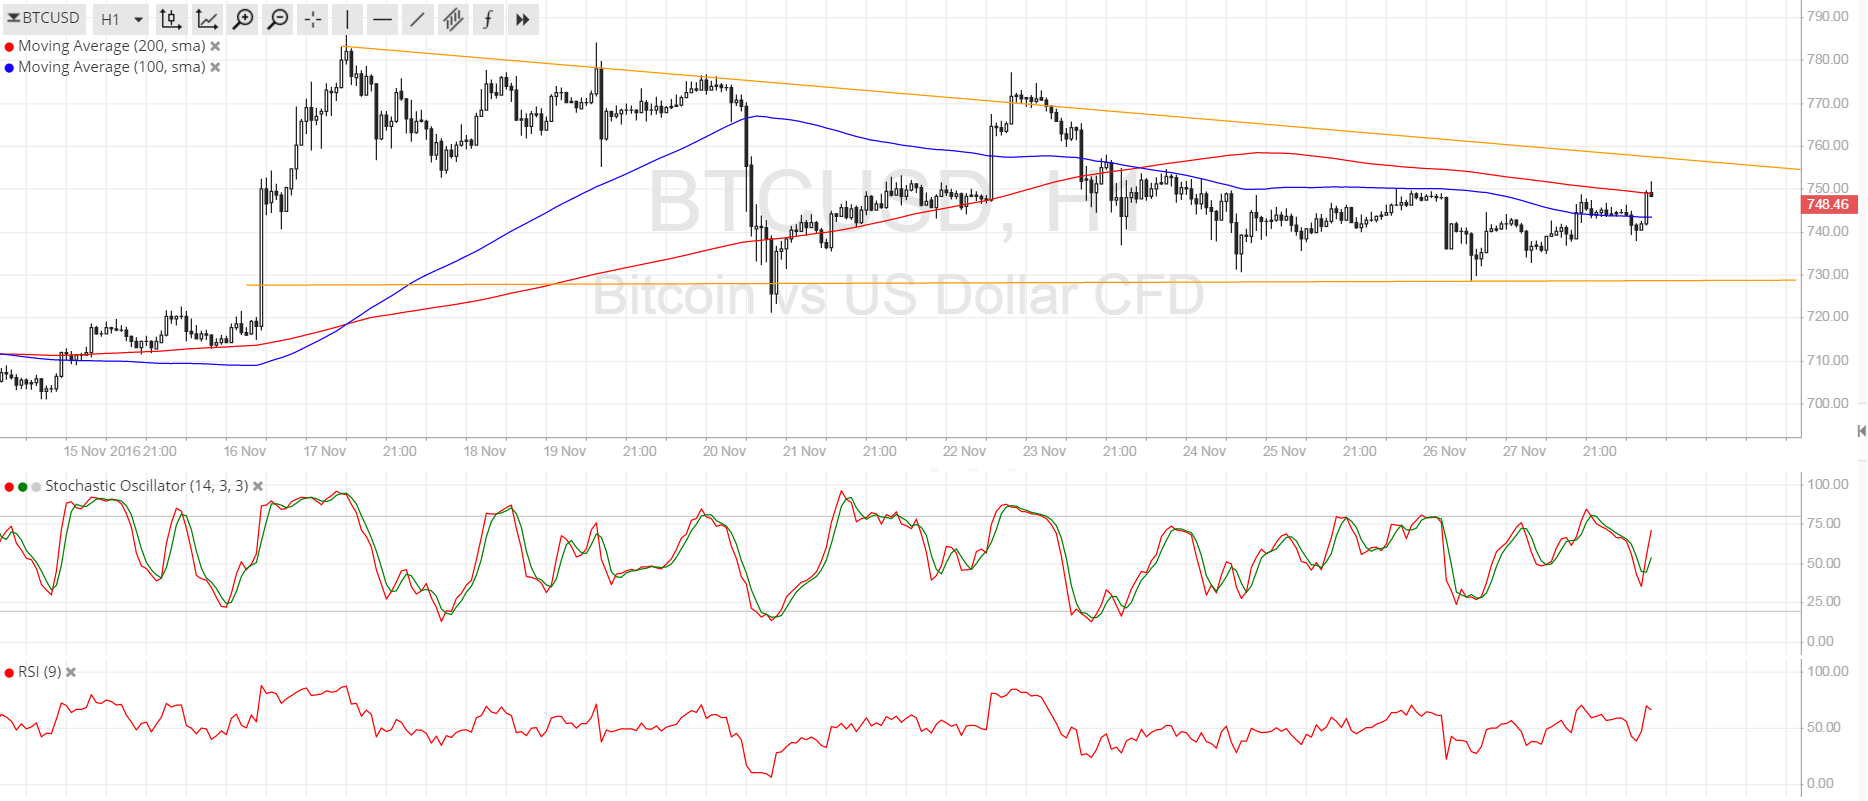
- Bitcoin price has formed lower highs and found support around $730, creating a descending triangle pattern.
- Price just bounced off support and might be ready for a test of resistance at $750-755.
- Technical indicators seem to be hinting that the resistance would hold, although a breakout is possible with this week’s event risks.
Bitcoin price is still stuck inside the triangle consolidation pattern but might be gearing up for a breakout soon.
Technical Indicators Signals
The 100 SMA is below the longer-term 200 SMA so the path of least resistance is still to the downside, which suggests that the top of the triangle could keep gains in check. Also, the 200 SMA is holding as dynamic resistance for now, possibly pushing bitcoin price back to the bottom of the chart pattern at some point.
Stochastic is turning up to show that buyers are in control of bitcoin price action for now while RSI is also heading north so bitcoin could follow suit. Once these oscillators hit the overbought zones and turn lower, selling pressure could return and force the cryptocurrency to retreat from its climb.

Market Events
US traders were off enjoying the Thanksgiving holidays since Thursday so liquidity was thinner than usual in the bitcoin market. Apart from that, Chinese traders appeared to hold out on taking large positions on reports that the government could employ additional fiscal stimulus and tighter market regulation.
Recall that bitcoin price slumped earlier in the month when rumors broke out that the government would restrict bitcoin trading in the mainland, and now investors are worried again that proposed state council regulation on businesses investing abroad could also impact bitcoin activity.
Still, if the Chinese government continues their efforts to devalue the yuan, investors could keep flocking to bitcoin and propping its price up even with talks of regulation. As for the US dollar, this week’s NFP release could still have an impact on price action, although odds of a Fed rate hike in December appear to be fully priced-in already. Downbeat results could mean some dollar weakness but impressive figures could drag BTCUSD down.
Charts from SimpleFX