Bitcoin Price Key Highlights
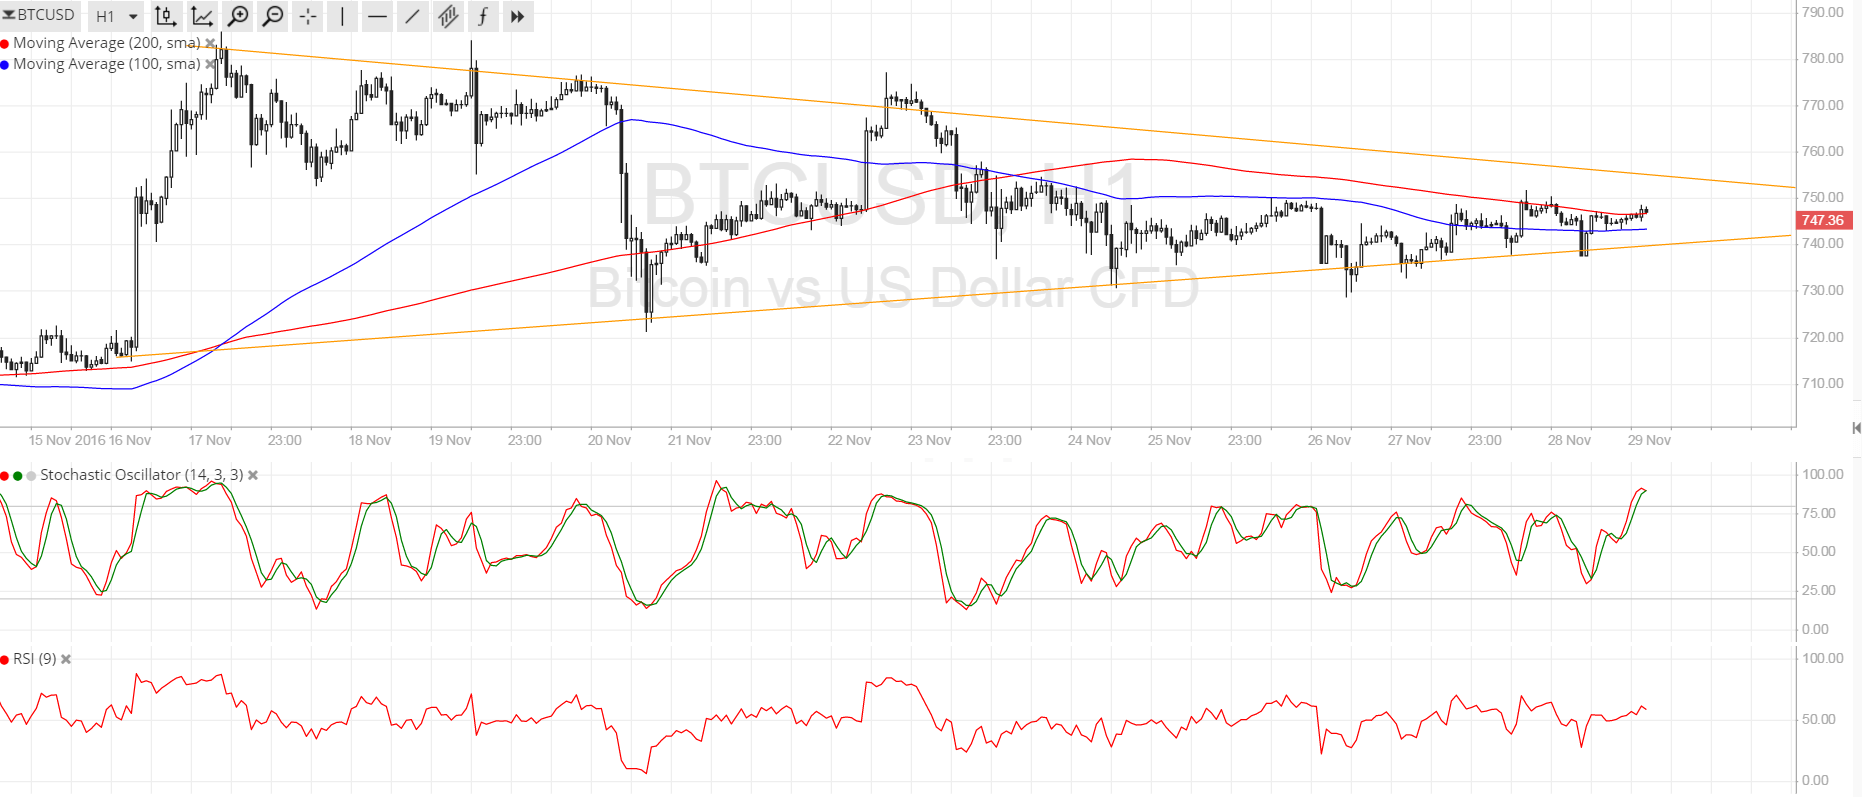
- Bitcoin price is still stuck in consolidation, moving inside a symmetrical triangle formation as illustrated in an earlier article.
- Price just bounced off the triangle support after a number of tests and is now making its way to the top.
- Technical indicators seem to be suggesting that a downside breakout is due.
Bitcoin price is still staying inside the consolidation pattern for now but could be ready to break out as it approaches the peak of the formation.
Technical Indicators Signals
The 100 SMA is below the longer-term 200 SMA, which means that the path of least resistance is to the downside. In other words, this hints that a break lower is more likely to take place compared to an upside breakout. Either way, the resulting move could take bitcoin price to the top of the triangle at $780 or to the bottom near $710 initially.
Stochastic is on the move up to show that buyers are in control of bitcoin price action for now. RSI is also heading north to show the presence of bullish pressure. However, stochastic is already approaching the overbought zone and might be ready to turn lower to suggest a return in selling momentum.

Market Events
Trading appears to have been off to a slow start this week as US traders might still be recovering from their Thanksgiving holidays or busy taking advantage of Cyber Monday deals. Kidding aside, the dollar also seems to have gotten weighed down by president-elect Trump’s Twitter tantrum over the weekend regarding the Wisconsin vote recount and the involvement of Clinton’s team, leading US equities to end lower on Monday on fresh uncertainties and a bit of profit-taking.
Still, bitcoin price remains supported as the new capital controls imposed by China could encourage investors to put money in bitcoin instead of other overseas investments. Sources have revealed that the state council is focusing its crackdown on multi-billion dollar deals being made outside the country so they don’t seem intent on limiting bitcoin activity in the mainland just yet.
Charts from SimpleFX