Bitcoin Price Key Highlights
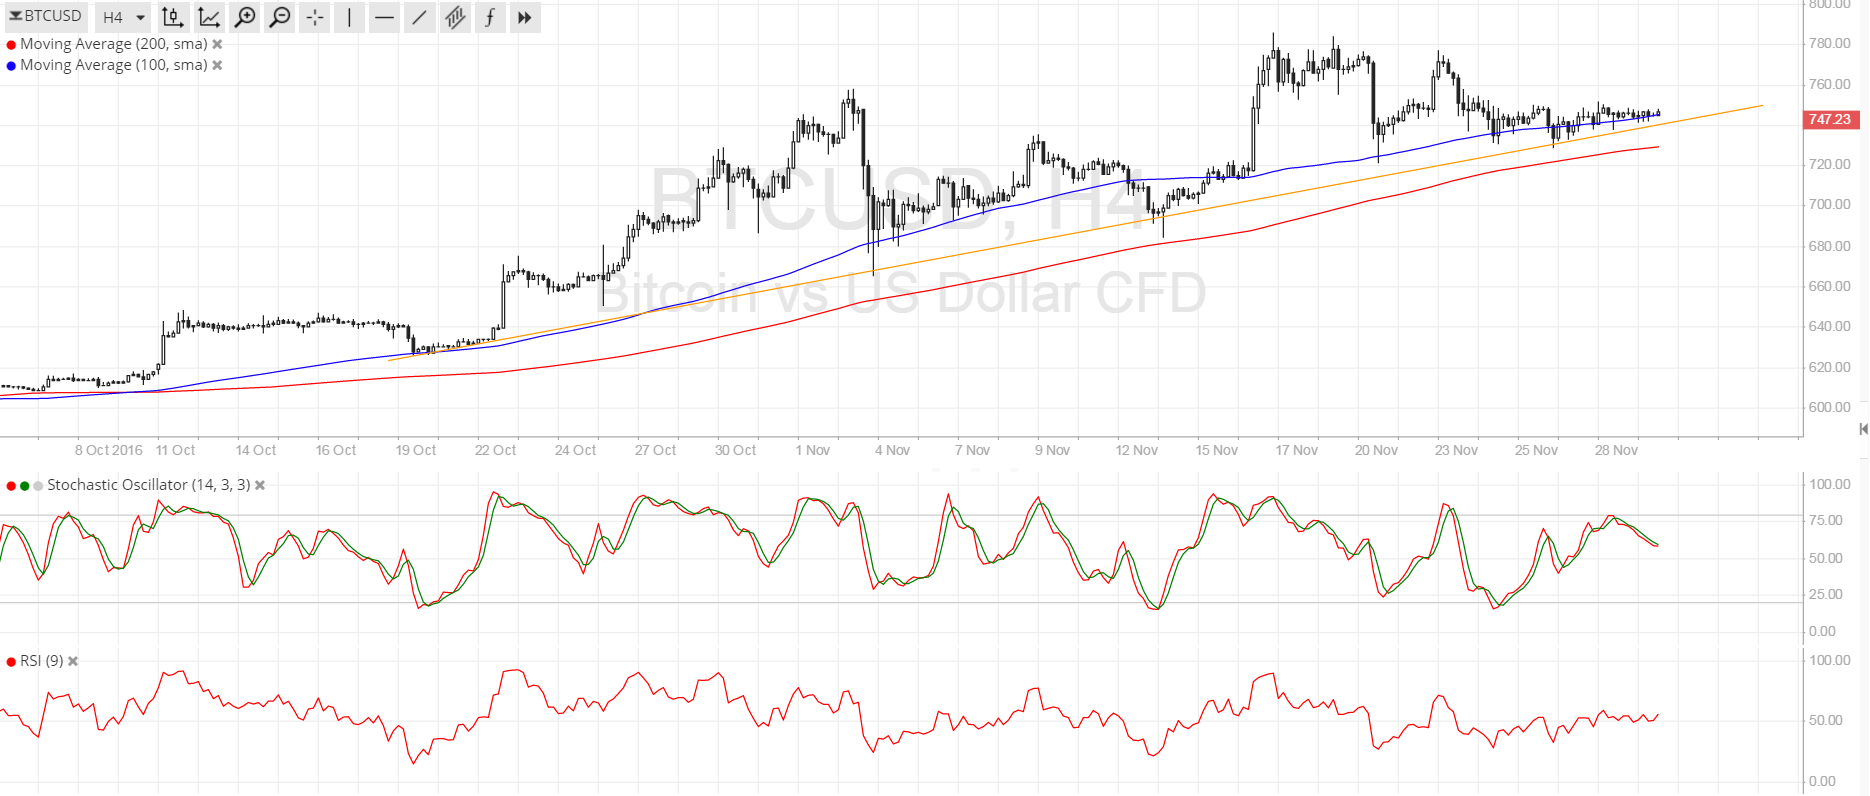
- Bitcoin price has been on an uptrend and is moving above a rising trend line visible on the 4-hour time frame.
- Price has been consolidating very close to the trend line recently, signaling that sellers are trying to push for a downside break.
- Price has also formed lower highs so selling pressure is mounting.
Bitcoin price is consolidating tightly right on the rising trend line support so a breakout might happen fairly soon.
Technical Indicators Signals
The 100 SMA is still above the longer-term 200 SMA so the path of least resistance is to the upside, which suggests that bitcoin price could break higher and probably make a run for the previous highs around $780. Also, the 100 SMA lines up with the rising trend line, adding to its strength as a floor.
However, stochastic is turning lower without even reaching the overbought zone, which means that bears are eager to hop in. RSI is on middle ground, barely offering any directional clues at the moment.
A downside break could encounter a bit of support at the 200 SMA dynamic inflection point. A move below this indicator could confirm that bears are gaining momentum and that a downward SMA crossover would follow, drawing even more sellers to the mix.

Market Events
Economic data from the US came in stronger than expected yesterday, as the preliminary Q3 GDP reading was upgraded from 2.9% to 3.2% while the CB consumer confidence index jumped to 107.1 to reflect a surge in optimism this November. This lends more support for the dollar but bitcoin price seems keen on staying afloat.
Chinese investors are still heavily invested in bitcoin and have shown no signs of liquidating large positions even after the government announced capital controls on offshore investments. In fact, this could even encourage stronger investor interest as they seek to circumvent these restrictions while hedging their yuan-denominated returns.
However, bitcoin price seems to be waiting for a really strong catalyst before resuming its climb, possibly in the form of another large wave in activity from Chinese investors. Be on the lookout for a surge in volume at the end of this month on profit-taking as well.
Charts from SimpleFX