Bitcoin Price Key Highlights
- Bitcoin price appears ready to bounce off support at the area of interest visible on the longer-term charts.
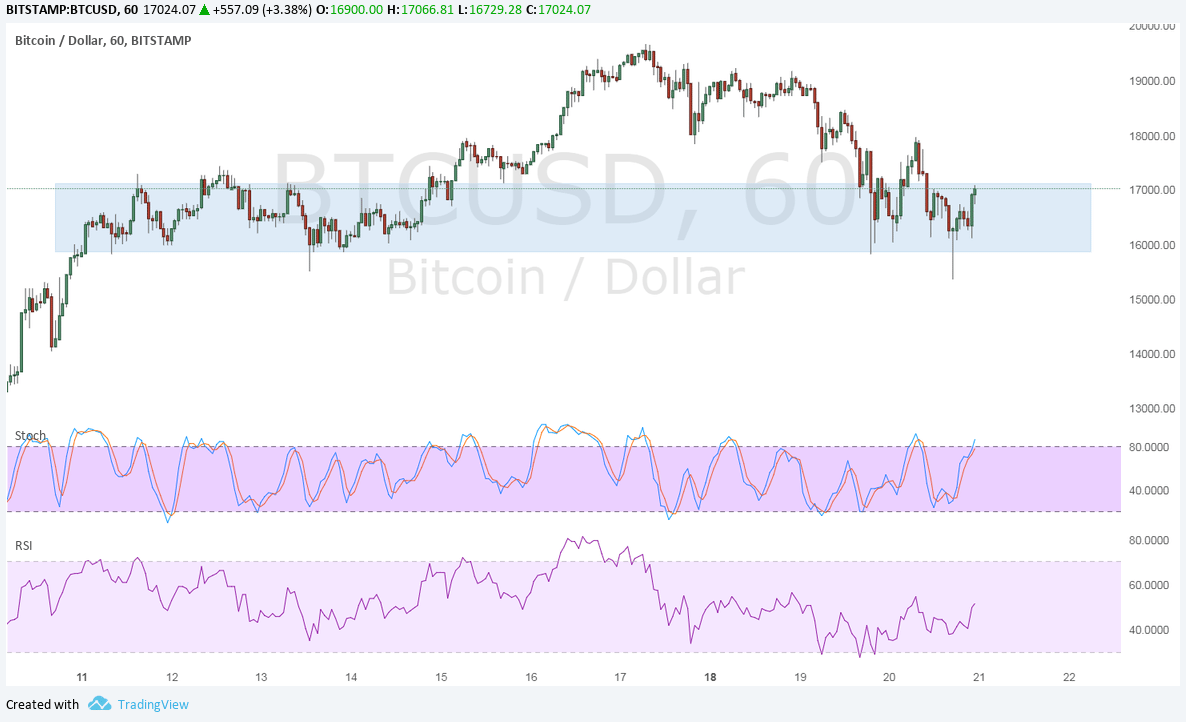
- Price seems to be forming a double bottom around the $16,000-18,000 levels and a neckline break could allow the climb to resume.
- In that case, bitcoin price could make its way back up to the swing high and beyond.
Bitcoin price continues to ward off bearish pressure around the $16,000 area of interest and might be ready to make a stronger rally.
Technical Indicators Signals
The 100 SMA is above the longer-term 200 SMA to confirm that the path of least resistance is to the upside. This means that the uptrend is more likely to carry on than to reverse, possibly taking bitcoin price up to the highs close to $20,000.
Stochastic is on the move up to show that buyers are on top of their game, but the oscillator is nearing overbought territory to reflect exhaustion. RSI has more room to climb, so bitcoin price might have enough bullish momentum for a neckline break.
Note that the double bottom is around $2,000 tall so the resulting break could be enough to take it up to the all-time highs.

Market Factors
The US dollar is holding its ground against most of its rivals as the tax reform bill was passed this week. This would spur stronger business activity and consumer spending, thereby boosting overall growth and keeping the Fed on its tightening cycle.
Meanwhile, bitcoin price appears to be losing the spotlight to other cryptocurrencies that are also on the rise. The $20,000 major psychological level is proving to be a tough barrier to break, so profit-taking has also come in play, especially since the end of the year is approaching.
There’s not much in terms of catalysts for both bitcoin and the dollar in the weeks ahead, so it’s likely that the correction could stay or consolidation could be in the works.