Bitcoin Price Key Highlights
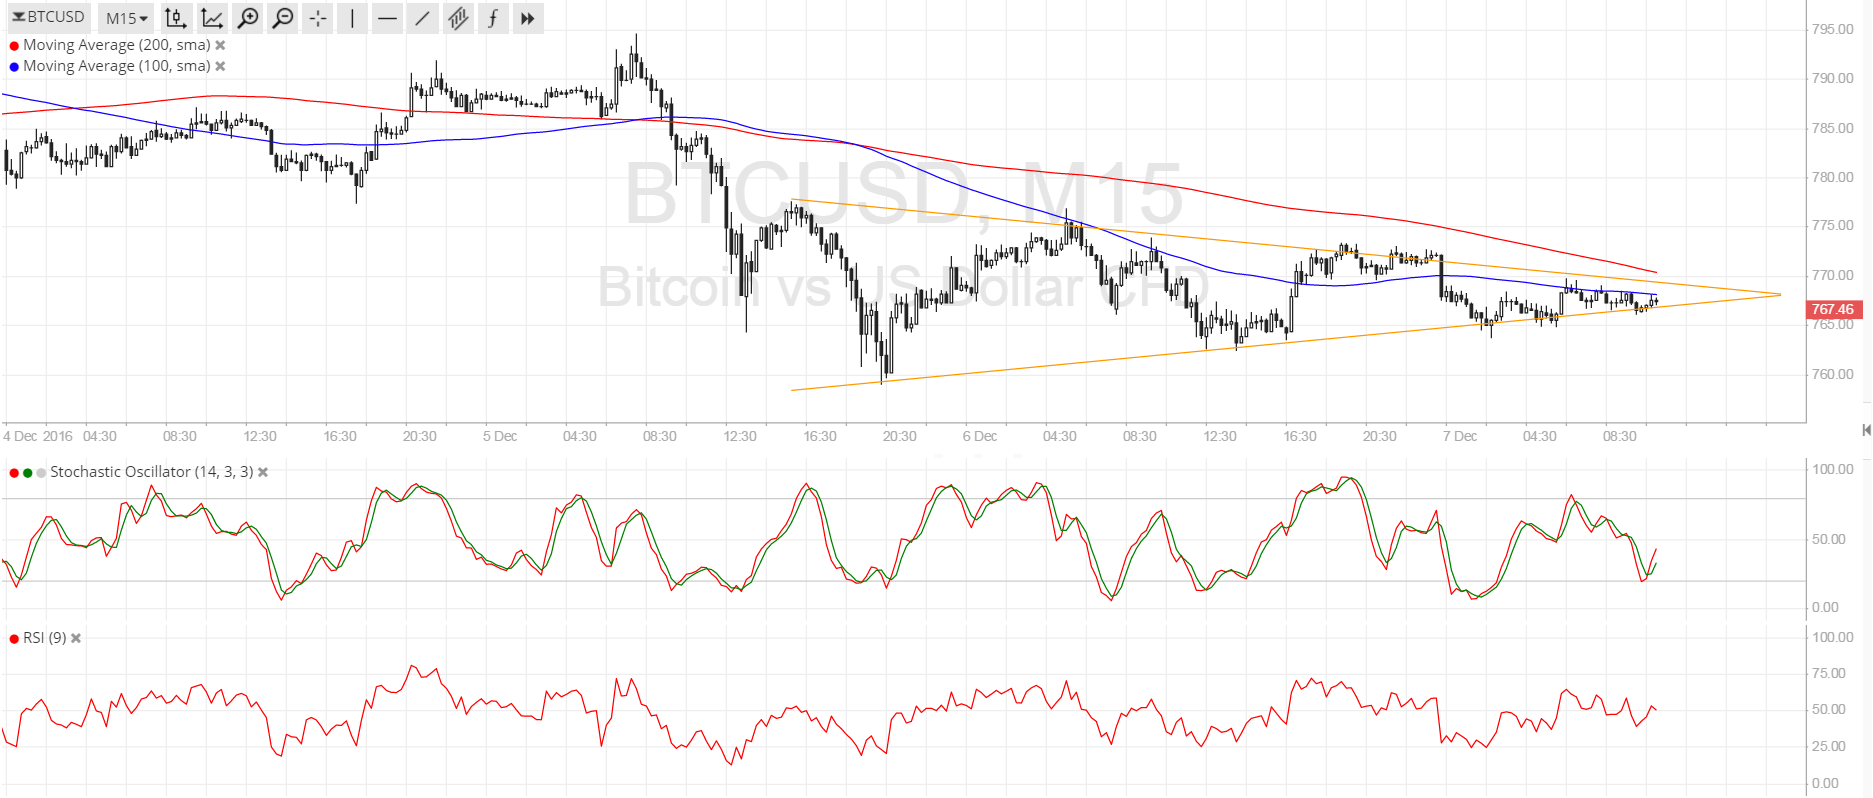
- Bitcoin price has been treading sideways recently and has formed a symmetrical triangle formation on its 15-minute chart.
- A breakout could be due sooner or later since price is approaching the triangle’s peak.
- Technical indicators are giving mixed signals on this time frame but longer-term charts suggest that the uptrend could remain intact.
Bitcoin price is stuck in consolidation on its short-term time frames but could be poised for a breakout soon.
Technical Indicators Signals
The 100 SMA is below the longer-term 200 SMA on this chart so the path of least resistance is to the downside. In other words, this suggests that a break below the triangle support and a resulting selloff are more likely than an upside breakout and a rally.
Stochastic is on middle ground so it’s barely providing strong directional clues at the moment while RSI is also moving sideways, hinting that the consolidation in bitcoin price could go on for a while.
A downside break from the triangle support at $765 could lead to a drop until the triangle lows at $760 while an upside breakout could lead to an initial climb until the triangle highs at $775. Stronger buying pressure could push it up to the next resistance at $780-795.

Market Events
Traders seem to be bracing themselves for the Chinese trade balance due later this week, as this could signal whether or not the government would pursue more yuan devaluation or implement additional restrictions on offshore investments.
If so, investors from the mainland could seek higher returns and a hedge against their yuan-denominated holdings by buying bitcoin. On the other hand, strong results could lift Chinese markets and encourage more investors to put money in local assets.
As for the US dollar, the Fed rate hike for next month seems well priced in already so strong US reports don’t do much to boost the currency against bitcoin price. With that, consolidation could continue until the actual announcement next week, which might spur profit-taking for BTCUSD.
Charts from SimpleFX