Bitcoin Price Key Highlights
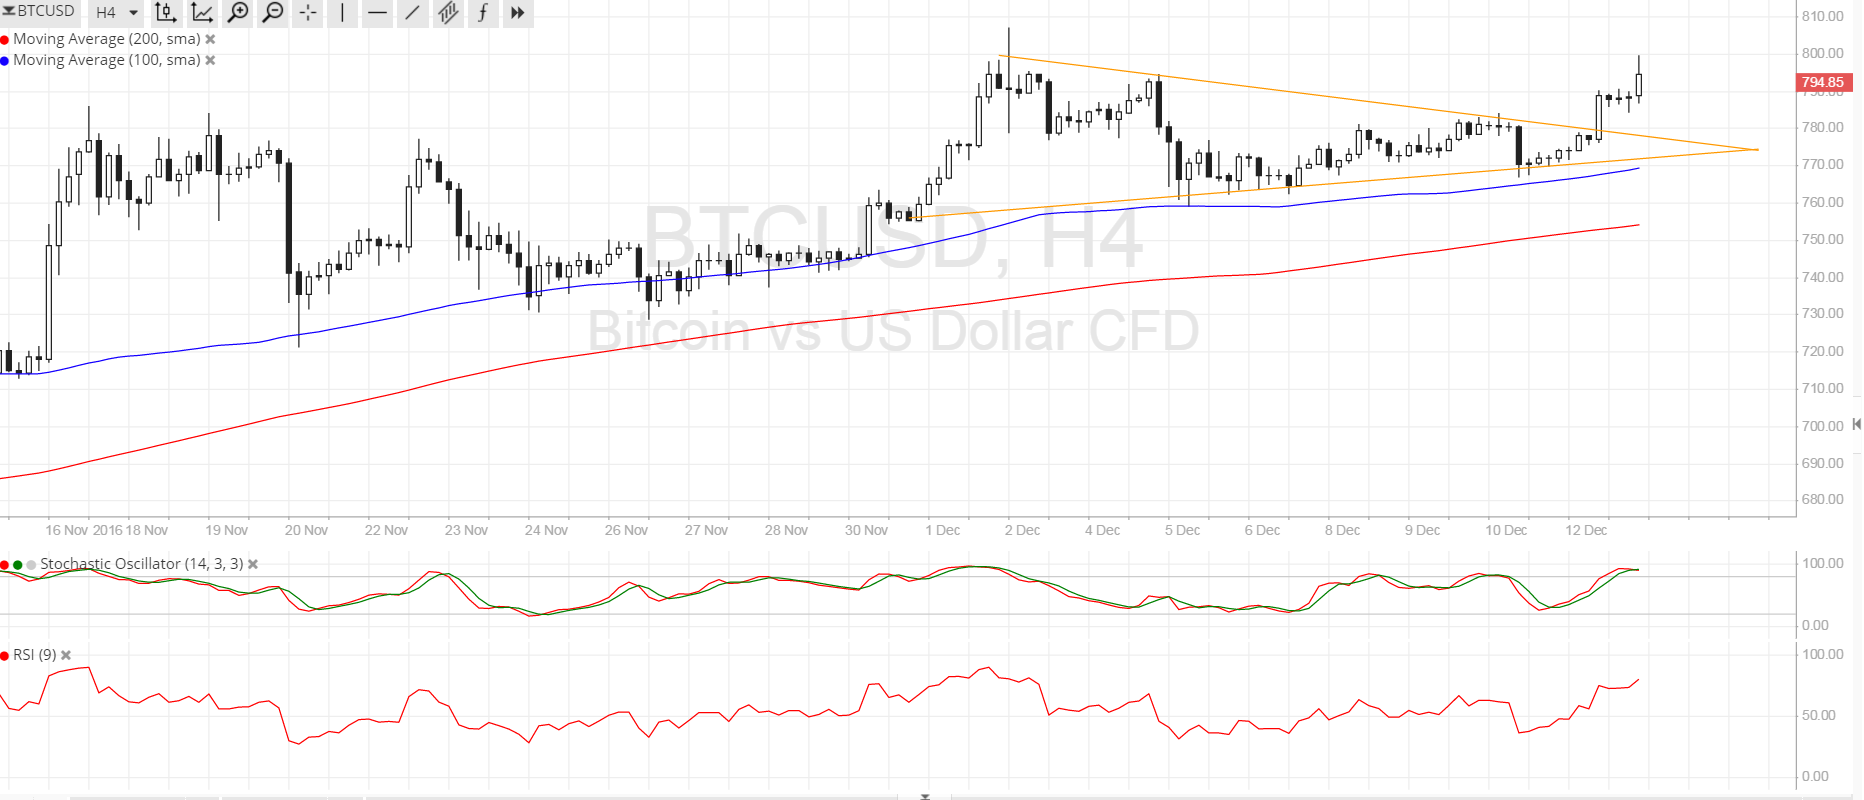
- Bitcoin price was previously stuck inside a symmetrical triangle consolidation pattern as bulls and bears were in a tight race.
- Bulls eventually won out as price made another upside breakout, following the previous break higher on an earlier triangle formation.
- This puts bitcoin price on track towards testing the $800 handle, which might spur profit-taking once more.
Bitcoin price broke out of its triangle consolidation pattern, indicating that bulls are ready to take control once more.
Technical Indicators Signals
The 100 SMA is above the longer-term 200 SMA on this bitcoin chart so the path of least resistance is to the upside. In the event of a pullback, the 100 SMA could continue to hold as dynamic support as it did so in the past corrections. It’s also worth noting that the previous upside triangle breakout led to the formation of new yearly highs so it’s possible that bitcoin price could break past the $800 barrier this time.
Stochastic is already indicating overbought conditions, which hints that buyers are starting to feel exhausted and may let sellers take over. Similarly, RSI is in the overbought area already so profit-taking could be possible.

Market Events
A lot hinges on the outcome of the Fed decision this week, as this would set the tone of longer-term dollar action against the rest of its counterparts, including bitcoin price. While an interest rate hike of 0.25% has been long priced in on Fed rhetoric and improving US data, traders are more interested to find out how long it will take before the US central bank hikes again.
If FOMC head Yellen indicates that they could keep rates unchanged for the next year or so, the dollar could retreat and bitcoin price would likely take advantage of this slide. On the other hand, if policymakers reiterate that more rate hikes are in the cards for the next six months, bitcoin could return some of its recent gains to the dollar.
Over in China, data came in mostly in line with expectations, reducing the need for the government to restrict yuan appreciation. Still, investors in the mainland are likely to keep the cryptocurrency supported as they seek alternative holdings while offshore investments are being closely monitored.
Charts from SimpleFX