Bitcoin Price Key Highlights
- Bitcoin price seems to be back inside its triangle consolidation pattern after a burst of volatility recently.
- Price broke to the upside of the triangle then snapped right back down to the bottom and is now moving sideways again.
- Traders could be bracing for bigger market catalysts ahead before pushing BTCUSD in a particular direction.
Bitcoin price faked out to the top and bottom of the symmetrical triangle formation as traders are positioning for major events.
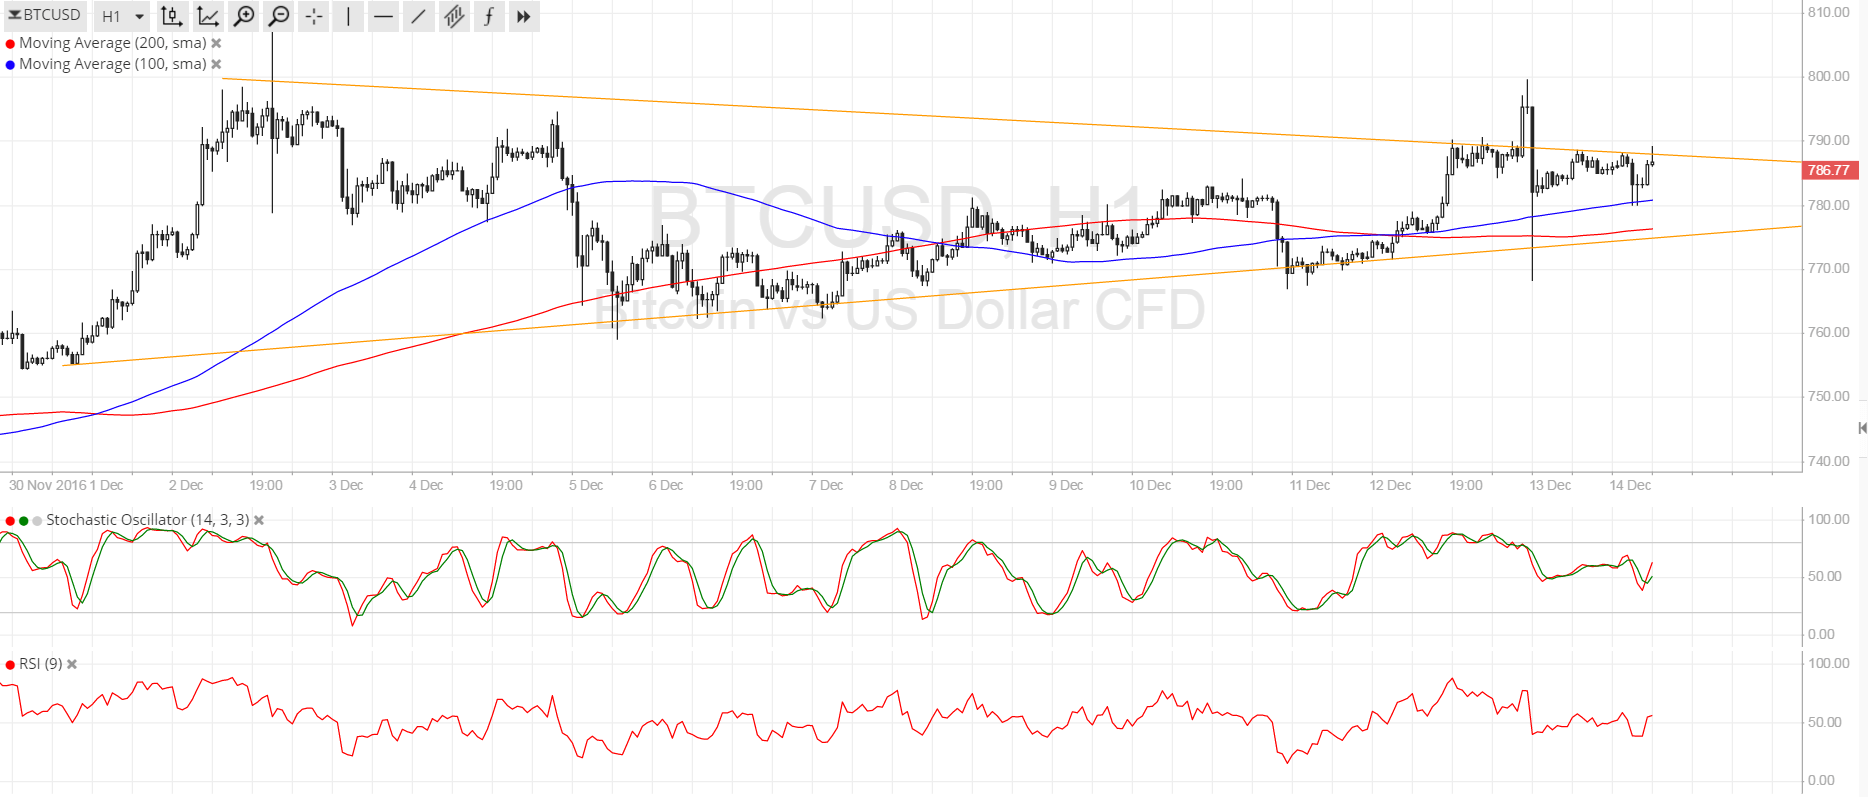
Technical Indicators Signals
The 100 SMA crossed above the longer-term 200 SMA on this time frame to indicate that the path of least resistance is to the upside. This suggests that a break higher is more likely to take place than a breakdown. In addition, the short-term MA is holding as dynamic support for the time being while the long-term moving average lines up with the triangle bottom.
Stochastic is on middle ground so there are no strong directional hints from this oscillator, although it’s worth noting that it also crossed higher and is pointing up to hint that buyers are trying to regain control. Similarly, RSI is treading sideways and is suggesting that further consolidation is due.

Market Events
The main event for the day is the FOMC statement as market watchers are eager to see whether there are more tightening moves lined up for the next few months or not. A rate hike has already been fully priced-in so this shouldn’t come as a surprise to dollar traders and bitcoin price, but the dot plot forecast of interest rates and the economic projections should garner more attention.
Upgraded growth and inflation forecasts could renew dollar demand as traders anticipate one or two interest rate hikes by next year. Still, Fed Chairperson Yellen could attempt to keep risk rallies in check by saying that they’ll wait to find out what the Trump administration has in mind first.
Either way, bitcoin price could be in for another round of volatile action during and after the press conference so wide stops are recommended if you’re trading BTCUSD then.
Charts from SimpleFX