Bitcoin Price Key Highlights
- Bitcoin price broke above its short-term consolidation and is on its way to making a solid move past $800.
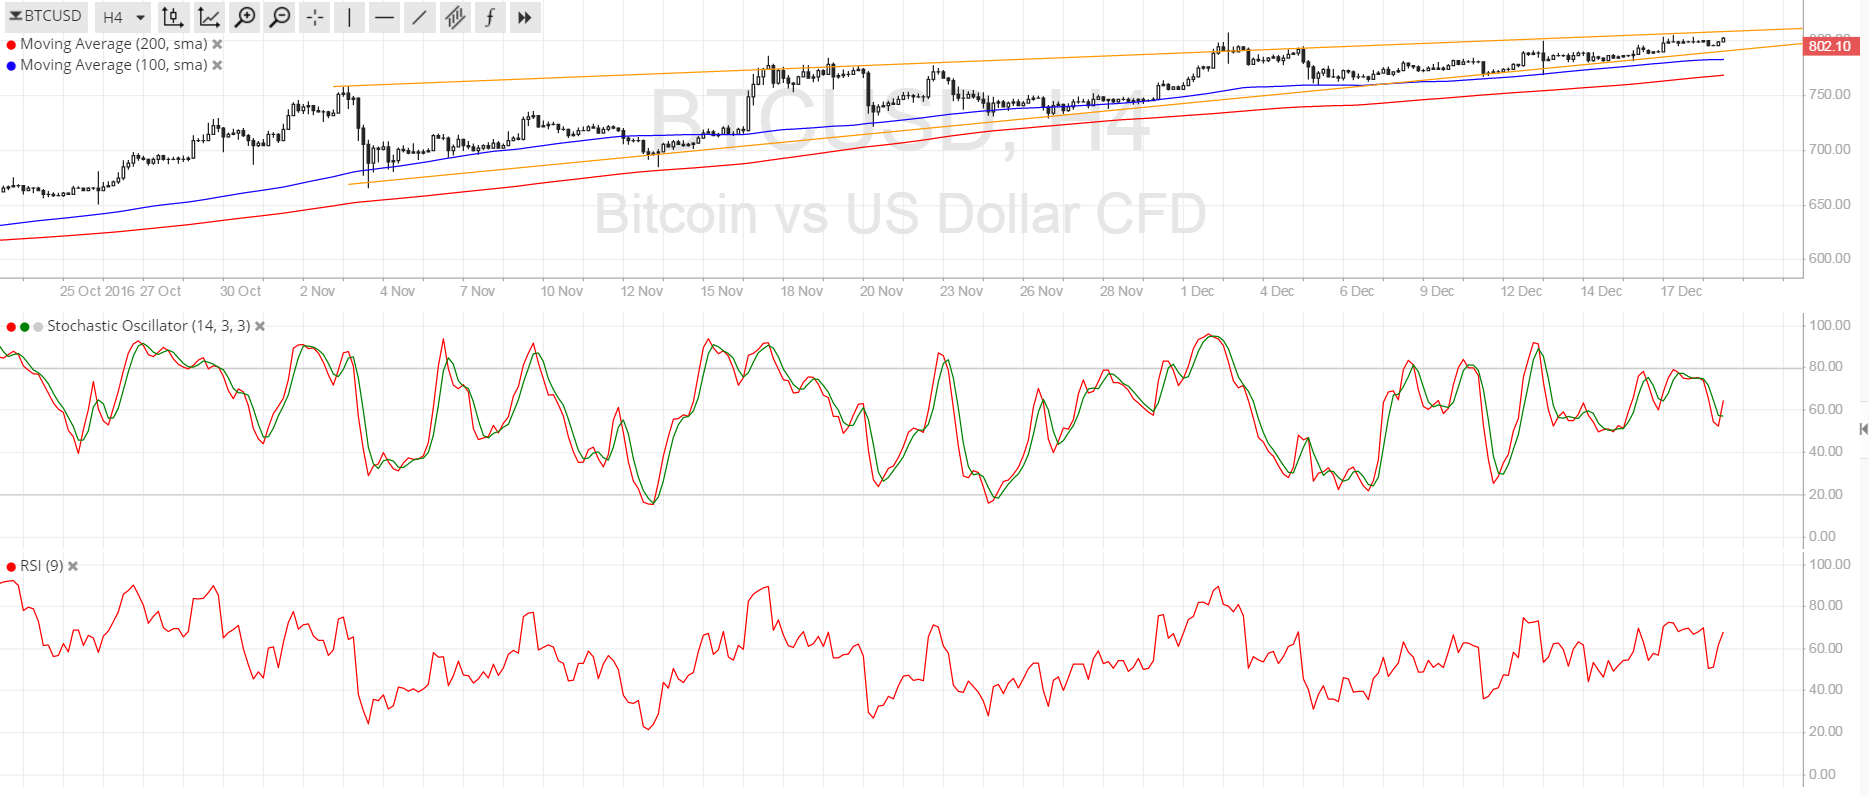
- Price is still moving carefully inside a rising wedge formation visible on its 4-hour chart.
- If the wedge resistance continues to keep gains in check, bitcoin price might be forced to break below support.
Bitcoin price is slowly treading higher, trying to muster enough energy for a strong break past $800.
Technical Indicators Signals
The 100 SMA is above the longer-term 200 SMA so the path of least resistance is to the upside. However, the gap between the moving averages is pretty narrow so a downward crossover could be possible, likely drawing more sellers to the mix.
Stochastic seems to be on its way down, also suggesting that bears are ready to regain control of bitcoin price action. RSI is turning higher to indicate that buyers will put up a strong fight.
The wedge formation spans $700 to $800 so a break in either direction could result to a move of the same magnitude. With that, bitcoin price could either head up to $900 in the long run or slide back to the $700 level.

Market Events
The US central bank decided to hike interest rates by 0.25% last week and signal room for three more rate hikes next year, thereby increasing demand for US assets and the dollar. This has made it more difficult for bitcoin price to extend its gains or make a sharper climb recently.
Apart from that, volume has been considerably lower in the past few days, possibly as traders are starting to book their profits as the end of 2016 approaches. If this behavior continues for the next couple of weeks, bitcoin could be in for a few more losses.
On the other hand, if traders don’t pass up the chance to rake in more profits before the year comes to a close, bitcoin price could see further upside until the $850 area. There’s not much in the way of major market catalysts, though.
Charts from SimpleFX