Although Bitcoin price dropped yesterday to around $210, it increased up to $233 at the time of writing of this article. Continuation of this bullish rally is likely to drive the price up to the next resistance level at around $256.
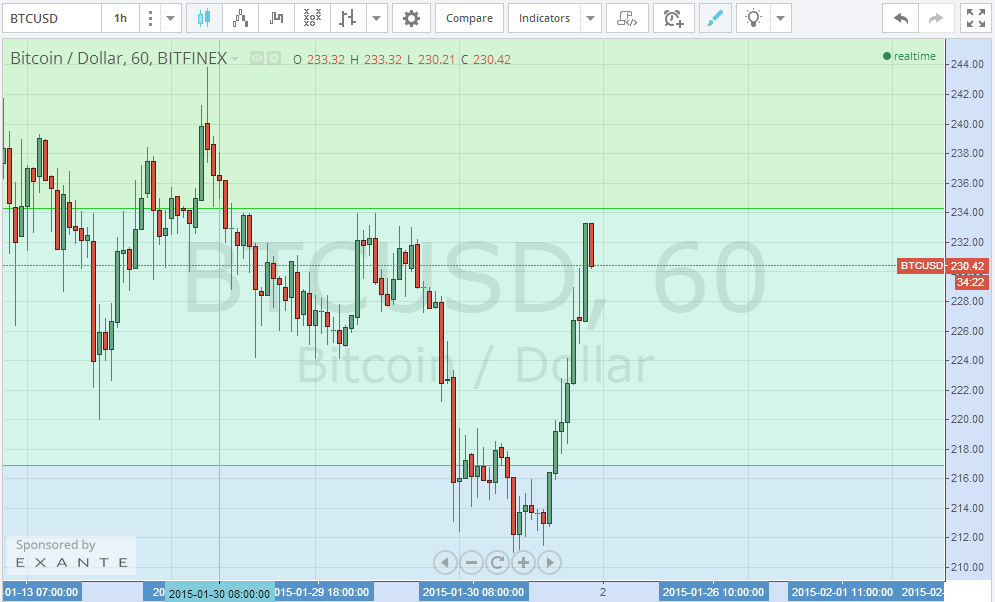
By studying the 1 hour Bitfinex (BTC/USD) charts from tradingview.com, we can notice 5 successive bullish green candles forming today secondary to an increase in the market’s buying power. The successive 5 bullish candles observed on the 1 hour charts represent a significant signal that flags growing strength of the bullish wave. Accordingly, as bitcoin price has already broken the $220 resistance level, which was a support level throughout the past few days, entering a long position trade near $220 can be set to take profit at $250-260 with a stop loss level at $200.
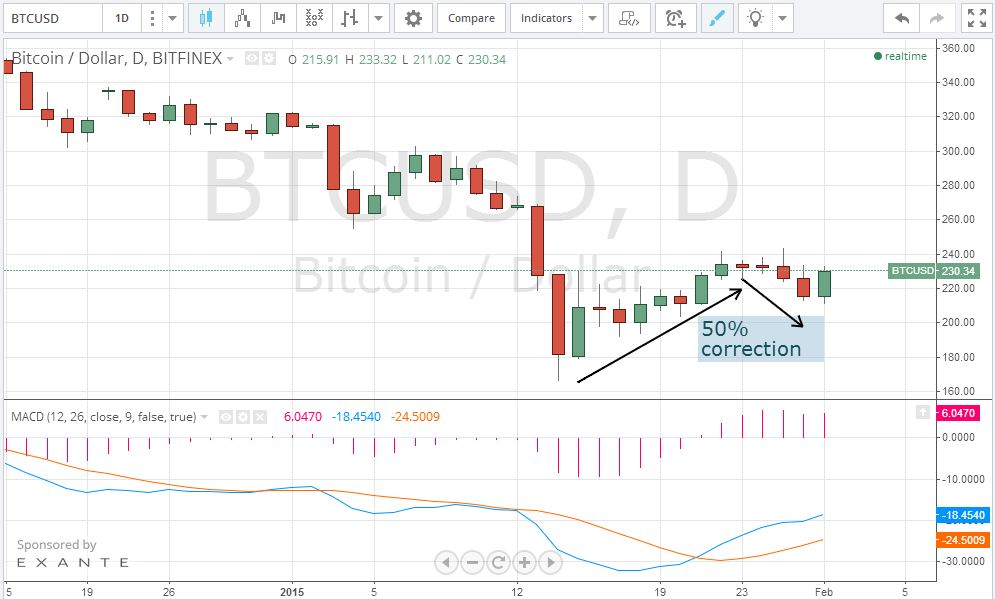
By studying the 1 day Bitfinex (BTC/USD) charts from tradingview.com, we can now better understand the tempo of the market since the 15th of January (look at the below chart). The decline in bitcoin price that occurred during the past few days can be viewed as a 50% correction to the bullish wave that started on the 15th of January. By plotting the MACD on the 1 day charts, we can now notice that the uptrend blue line has crossed over the signal red line which is in favor of continuation of the bullish wave that started earlier today.
Conclusion:
Bitcoin price seems to have stopped falling as the bearish wave reversed as it approached the $200 support level. We expect the price rising up to $256 during the next couple of days.