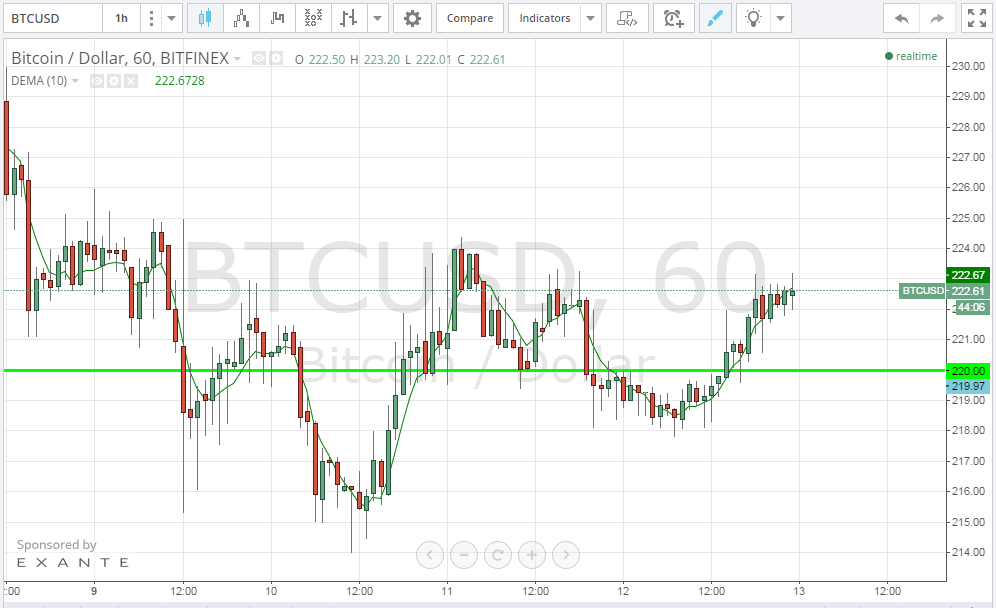
During most of today’s trading session, bitcoin price has been rising. Bitcoin price is trading over $222 at the time of the writing of this analysis, and is expected to rise even more.
By studying the 1 hour Bitfinex (BTC/USD) charts from tradingview.com, we can notice that bitcoin price started the day by trading around $219, igniting another overshoot below the $220 support level which was later on corrected, as we predicted yesterday., The price rose up to score a high of $23.06 later on. As the price has just risen above $220, the probability of a further rise remains high, especially since the price has been moving above the 10 day EMA during many of today’s trading sessions. In my opinion, if bitcoin price rises above $225 during the next few hours, we can see it reach the $256 resistance level during another 2-4 hours.
By studying the 4 hour Bitfinex (BTC/USD) chart from tradingview.com and plotting the William’s Alligator indicator and the Vortex Indicator (VI), we can notice the following:
- The alignment of the VI trend lines is rather perfect for an upcoming bullish rally; the positive blue trend line has crossed above the negative red trend line and the gap between them seems to be wide and increasing; both signs are in favor of an upcoming bullish wave
- The 3 moving averages of William’s alligator are about to align with the red line in the middle, the blue below and the green above both, which would signal a bullish wave.
Accordingly, a bullish wave can be observed during the next 8 hours.
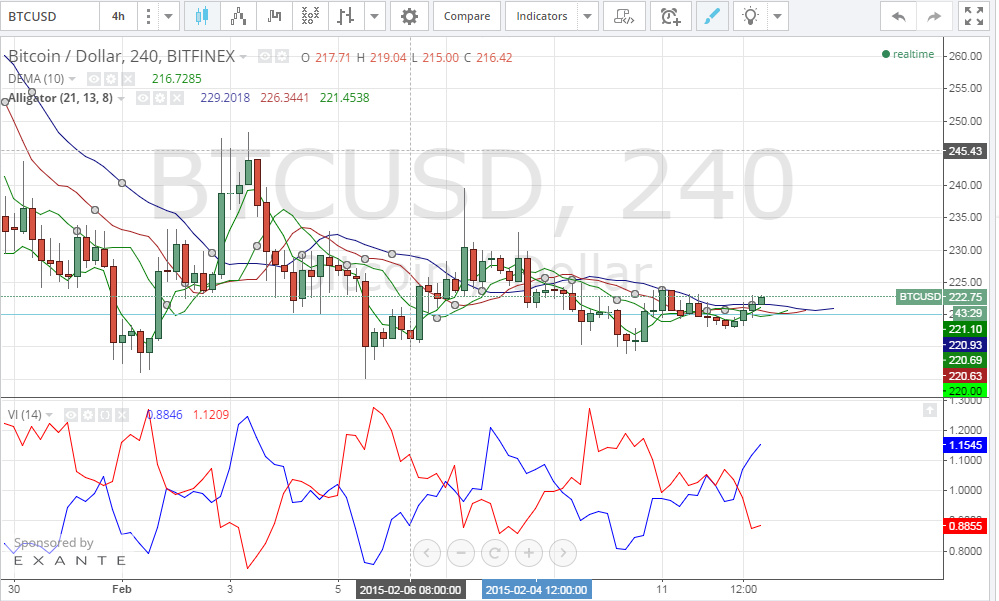
Note: The Vortex Indicator and William’s Alligator indicator are usually used on 1 day Forex charts, but we have been using both of them to analyze 1 hour (BTC/USD) charts to predict short trends. We used a 14 hour period to calculate the value of the Vortex Indicator trends. We used the 13 hour, 8 hour and 5 hour moving averages to plot William’s Alligator “lips,” “teeth” and “jaw” respectively.
Conclusion:
Bitcoin price continues to resist dropping below $220. Analysis points to the high probability of an upcoming bullish wave.
Charts from Bitfinex.