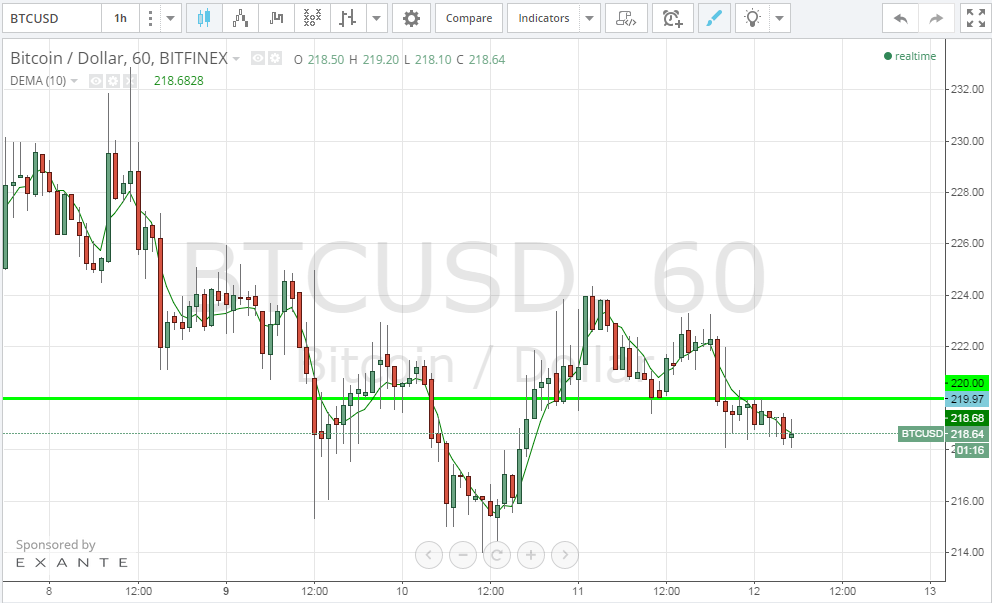
Bitcoin price attempted to rise away from the $220 support level and the price recorded a high of $224.34 earlier today before trading sideways to $220 during the rest of the day.
By studying the 1 hour Bitfinex (BTC/USD) charts from tradingview.com (look at the below chart), we can understand today’s trading pattern. Bitcoin price increased from $220.73 to $224.34 before falling down again to test the $220 support level earlier today. The $220 support level reversed the bearish wave driving the price upwards again to over $223. At the time of the writing of this article, bitcoin price dropped below $220 to $218.53; however, we are likely to see the price rise up above the $220 support, and what we are seeing now can be nothing more than another “overshoot below support” behavior.
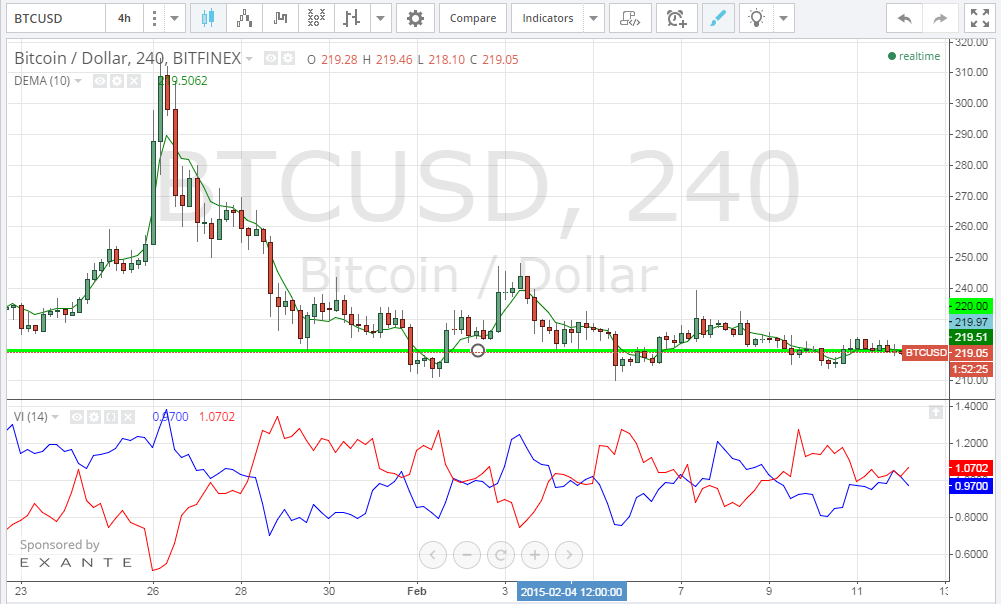
By observing the 4 hour Bitfinex (BTC/USD) charts from tradingview.com and plotting the Vortex Indicator accordingly (look at the below chart), we can notice the following:
– Bitcoin price seems to be well supported above $220 since the 23rd of January.
– As concluded by the Vortex indicator, there are no signs of a bullish rally soon since the blue positive uptrend line has crossed below the red negative downtrend line. Also, the gap between the two lines is rising so it won’t be until some time that we can see the blue uptrend line cross above the red downtrend line ahead of a bullish wave.
Conclusion:
Bitcoin price has been mostly trading sideways to the $220 support level today. If the $220 level continues to prove to be strong enough, bitcoin price will eventually increase with a week.