Bitcoin Price Key Highlights
- Bitcoin price recently made a strong surge, but it appears that bulls are running out of steam.
- A larger correction might be needed in order to draw more buyers to the mix and allow the climb to resume.
- Price is stalling just below the latest highs near $940 and appears to be testing near-term support areas.
Bitcoin price is taking a bit of a break from its ascent, probably waiting for more bulls to join in.
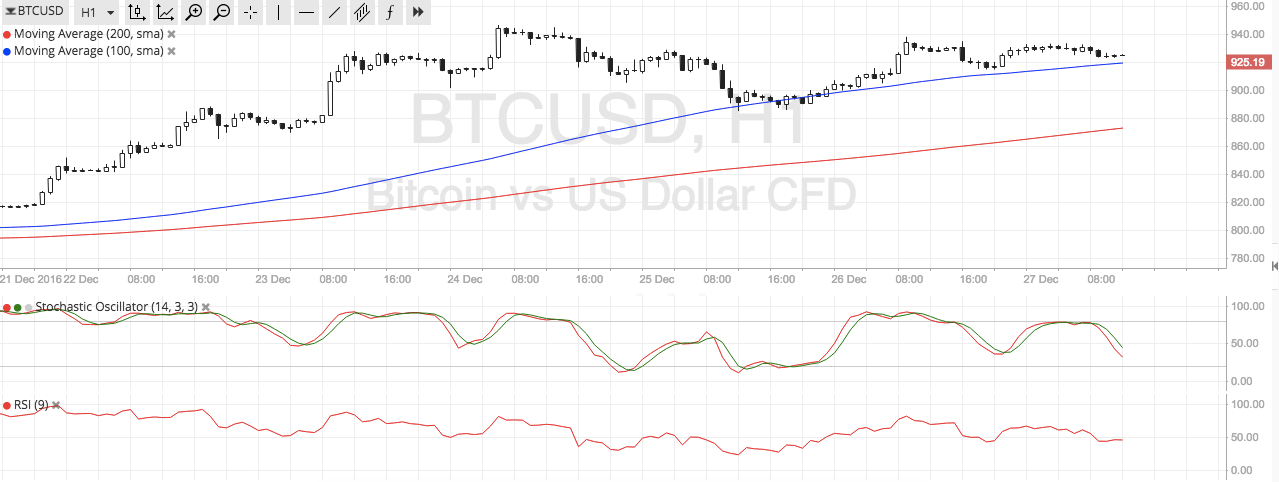
Technical Indicators Signals
The 100 SMA is above the longer-term 200 SMA on the 1-hour chart, confirming that the path of least resistance is still to the upside. In addition, the gap between the moving averages has considerably widened, which reflects increasing bullish momentum.
The 100 SMA is holding as dynamic support for the time being, as bitcoin price made a couple of tests of this nearby floor before making quick bounces. It seems that another test is due, and how price reacts to the $925 area could determine whether or not a major retracement is underway.
A break below the 100 SMA could open the door for a test of the longer-term 200 SMA at $870-880 or at least until the previous pullback to $890. However, this could lead to the formation of a double top, which is a classic reversal signal.
Meanwhile, stochastic is on its way down to suggest that sellers are in control of bitcoin price action for now while buyers take a break. RSI is treading sideways so there are no strong directional clues from this oscillator at the moment.

Market Events
There hasn’t been much going on in the financial markets these days as most stock exchanges have been closed on Monday and aren’t set to reopen until the middle of the week. Still, this thin liquidity environment could be a recipe for more volatile moves, as sizeable orders could be enough to move bitcoin price in a particular direction.
So far, dollar demand has faded as investors are starting to price in concerns about Trump’s administration and the potential impact of trade renegotiations on the US economy. Tensions in the Asian region, particularly between China and Taiwan, are dampening investor sentiment.
Charts from SimpleFX