Bitcoin Price Key Highlights
- Bitcoin price hasn’t made much headway north after pulling back to a nearby support zone.
- Price seems to be moving inside a rising wedge pattern, as buyers are trying to push higher while sellers are also putting up a strong fight.
- Technical indicators are hinting that further gains are in the cards for bitcoin price.
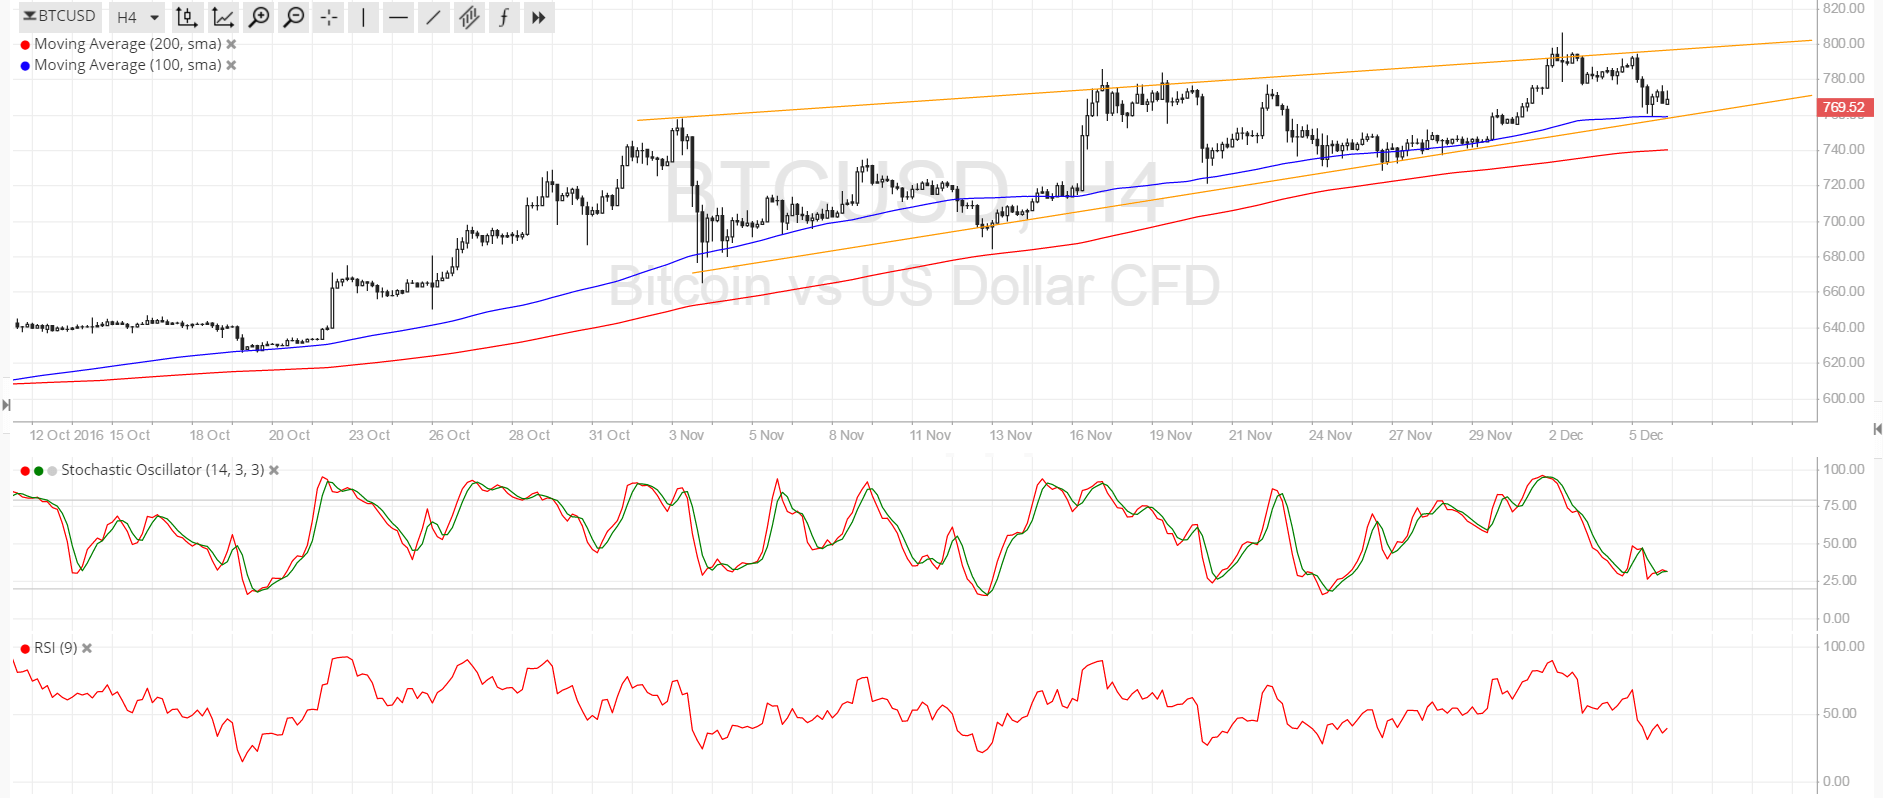
Bitcoin price appears to be trading inside a rising wedge pattern on the 4-hour chart and is currently testing the bottom.
Technical Indicators Signals
The 100 SMA is above the longer-term 200 SMA on this time frame so the path of least resistance is to the upside, which means that a bounce is more likely to take place than downside break. In addition, the 100 SMA lines up with the rising wedge support, adding to its strength as a floor. A larger bitcoin price correction could still find support at the 200 SMA dynamic inflection point.
Stochastic is approaching the oversold region to indicate that selling pressure could weaken soon. RSI is also heading south so bitcoin price could follow suit then turn higher once the oscillator indicates oversold conditions. However, if bears are strong enough, a downside break from the 200 SMA could signal that a reversal from the uptrend is due.

Market Events
Traders have turned their attention to the goings-on in Europe so there wasn’t much action in the bitcoin arena recently. The US dollar has held on to some of its gains when risk appetite weakened but was unable to extend its climb once risk-taking resumed.
There are no major reports due from the US economy in the next few days, with the spotlight on the ECB interest rate statement. Next week, the FOMC will make its policy decision and likely increase interest rates, although this scenario has already been priced in for the past few weeks. With that, profit-taking on the dollar against bitcoin price might be seen, possibly leading to a bounce back to the resistance at $800 or higher.
Charts from SimpleFX