Bitcoin price ranged yesterday between $252 and $256, so the price remained trading just below the 38% Fibonacci retracement level at around $257 after the bullish rally that pushed the price above $250 last Friday.
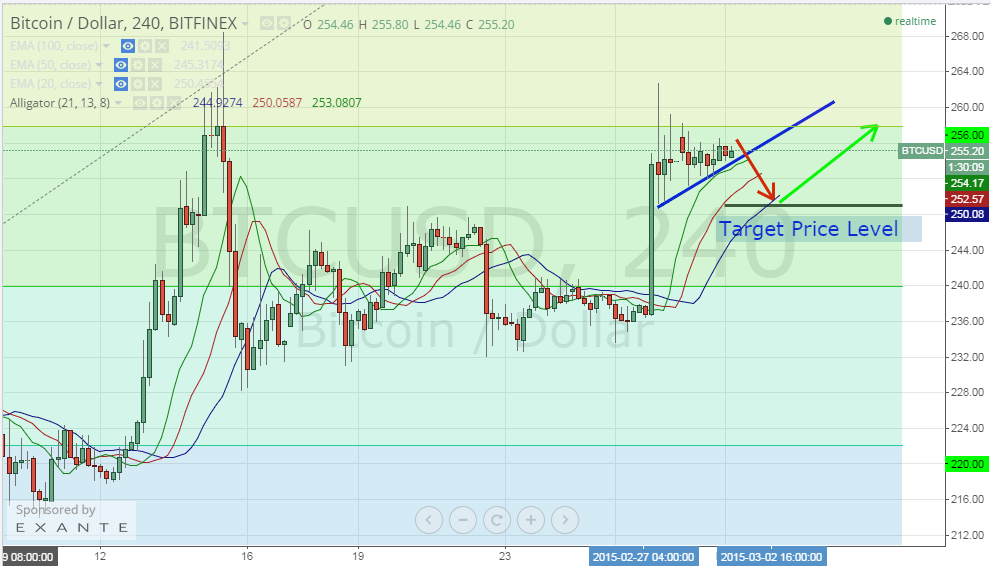
By studying the 4 hour Bitfinex (BTC/USD) chart from tradingview.com, drawing a trend line between the low reached on the 10th of February ($214) and the high reached on the 15th of February ($268) and plotting the Fibonacci retracement levels and plotting the William’s Alligator indicator accordingly (look at the below chart), we can conclude the following:
- After Friday’s bullish wave, bitcoin price dropped below the 38% Fibonacci retracement level and we can expect to see it drop to around $249 (look at the target price correction level on the below chart), as the market attempts to correct price, before we can see it rise up again to test the resistance at $257.
- Following Friday’s bullish rally, bitcoin price has been showing a rising support level since then as shown by the blue trend line on the below chart. Accordingly, we can note higher lows on the 4 hour charts which is a good sign pointing to the relative strength of the market’s buying power.
- The moving averages of the William’s Alligator show a bullish alignment as the blue line (lips) is on the bottom, the red line (teeth) is in the middle and the green line (jaw) is on top, so we are likely to see bitcoin price rise to $257 or even higher within the next 24 hours or so.
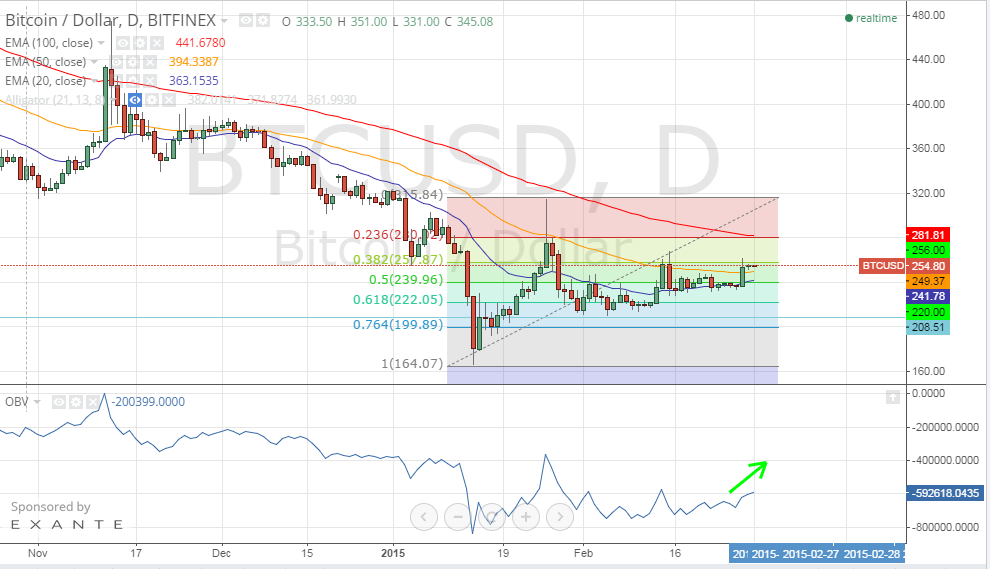
By studying the 1 day Bitfinex (BTC/USD) charts from tradingview.com, plotting the 20, 50 and 100 day EMAs and executing the On-Balance Volume oscillator, we can notice the following:
- The price is now above the 20 day EMA and the 50 day EMA. If the price remains to be above these moving averages, we can see bitcoin price rise again soon.
- The On-Balance volume oscillator is sloping in an upwards direction, which confirms the buying power of the market so we can see the price rise to test the 38% resistance level within the next 24 hours.
Conclusion:
Bitcoin price remained between $252 and $256 throughout yesterday’s trading sessions. Our technical analysis predicts another rise in bitcoin price to test the next resistance level within the next 24 hours.
Charts from bitfinex