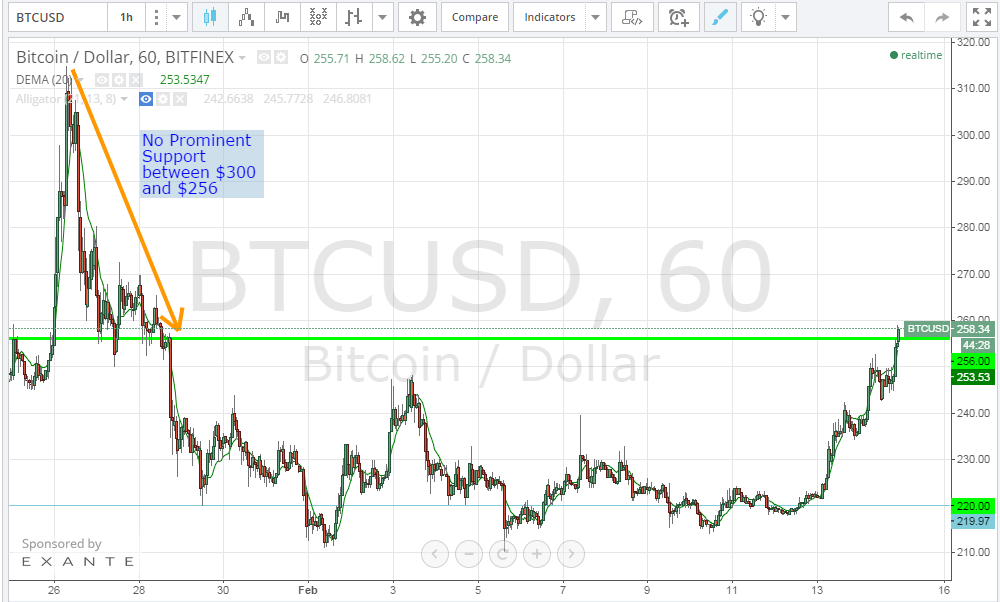
Bitcoin price continued rising today and the market’s buying power pushed the price up to a high of $258.92. At the time of my writing of this analysis, bitcoin price is testing the $256 resistance level.
By studying the 1 hour Bitfinex (BTC/USD) chart from tradingview.com and drawing a horizontal line across the $256 resistance/support level (look at the below chart), we can notice that on the 26th of January 2015, bitcoin price exceeded $300. We can also note that the price didn’t face any support all through the way from $300 down to $256. Oppositely, as bitcoin rises above $256, it will face negligible resistance all the way up to $300. In other words, if the price settles above $256 for a few hours, we can expect to see it reach $300 within less than 48 hours.
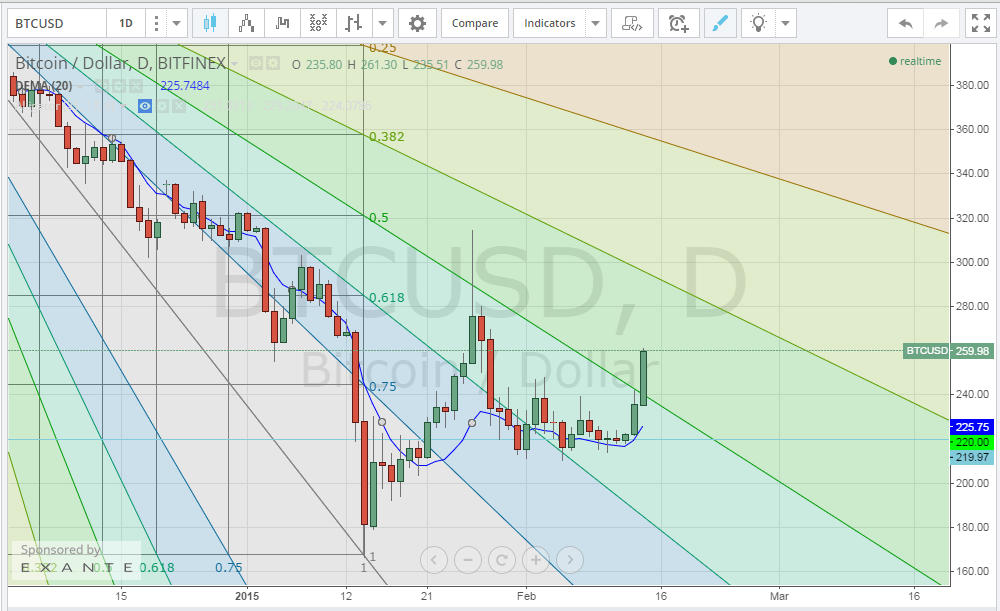
By analyzing the 1 day Bitfinex (BTC/USD) chart from tradingview.com and plotting the Fibonacci retracement fan, as we did through yesterday’s analysis, and calculating the 20 day EMA (the blue curve on the below chart), we can see how today’s bullish wave managed to break through the 50% Fibonacci retracement fan level. Also, bitcoin is now trading above the 20 day EMA which is in favor of continuation of the bullish wave. As per our analysis during the past couple of days, we can find many signals pointing to the strength of the current bullish wave and how it can easily push bitcoin price up to $300.
Conclusion:
Bitcoin price is breaking through the $256 resistance level digging its way to the $300 resistance level during the next 48 hours or so. Technical analysis is conveying multiple signs confirming the strength of the current bullish wave.