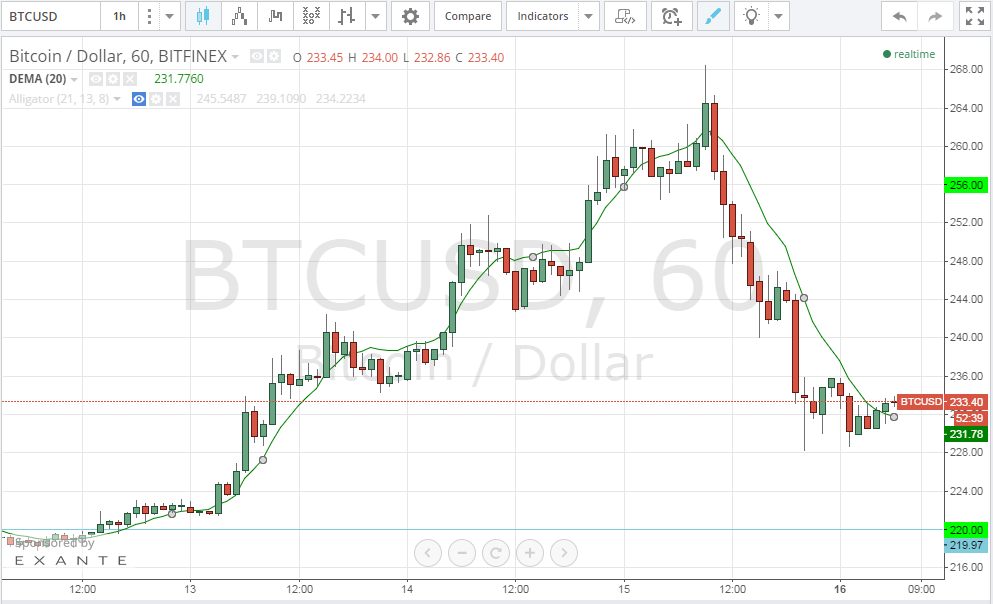
Bitcoin price dropped today to a low of $228.45. It seems that the buying power of the market didn’t succeed in maintaining the price above the $256 support level for a long time.
By looking at the 1 hour Bitfinex (BTC/USD) chart from tradingview.com and plotting the 20 day EMA on top of the chart, we can see how bitcoin price exhibited a rather steep drop from $268.34 to around $228.45 today. The bearish wave seems to be gaining strength as shown by the 7 successive red bearish candlesticks on the 1 hour chart. Also, the price has been trading below the 20 day EMA during most of today’s trading sessions. However, this downtrend lost momentum as the price approached the $220 support level, so the upcoming hours will decide whether $220 can prevent further price drop, or bitcoin price would test the $200 support level soon.
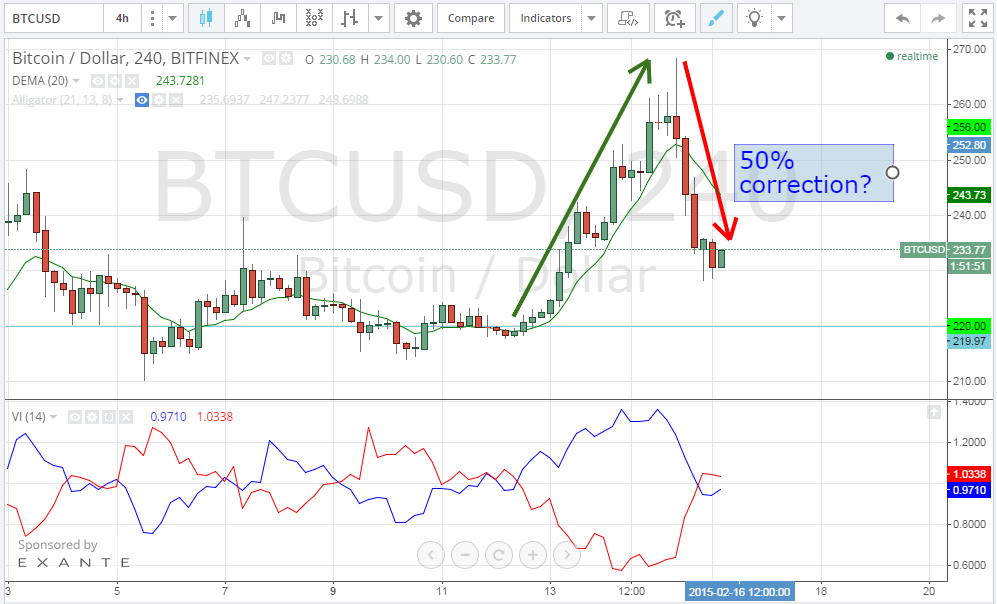
By analyzing the 4 hour Bitfinex (BTC/USD) charts from tradingview.com and plotting the Vortex Indicator accordingly, we can see how today’s price drop can be viewed as a 50% correction of the bullish wave that started on the 12th of January. A price correction wave can pull the price down to 70% of the increase experienced during a bullish wave. In my opinion, bitcoin price will start rising again after testing the $220 support level. By studying the Vortex Indicator, we can notice the following:
- The red downtrend line has crossed above the blue uptrend line, so another bullish wave will be delayed until this arrangement is reversed.
- Before the bearish wave started, the gap between the uptrend and downtrend lines decreased markedly. Such sign should have been used as a signal to close long positions before price drop is inevitable.
Conclusion:
Today’s Bitcoin price decline wasn’t anticipated, especially after the bullish wave that we have been experiencing during the past couple of days. We expect the price to start rising again after retesting the $220 support level.
Charts from Bitfinex.