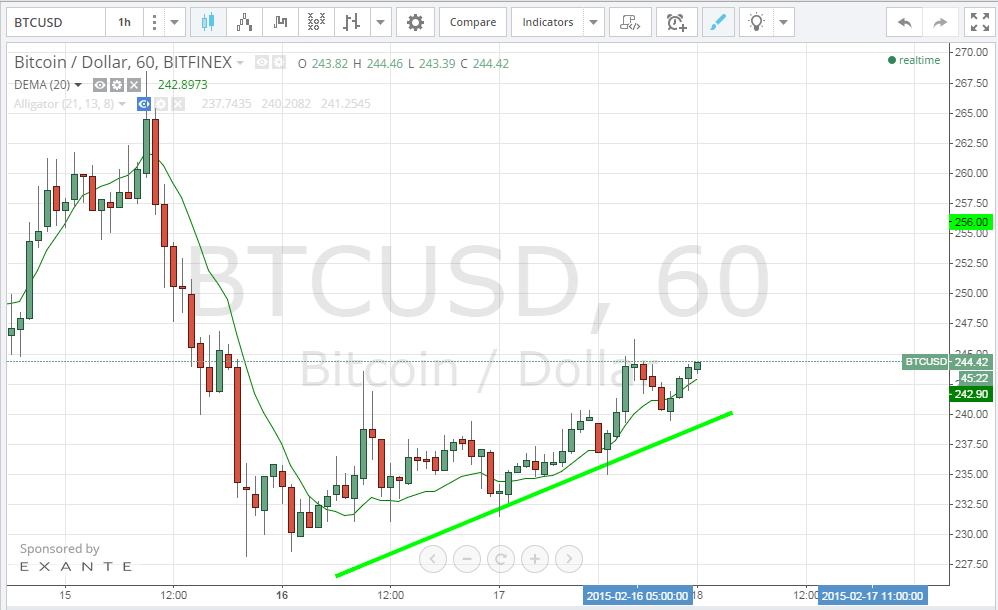
Bitcoin price is advancing according to our earlier analysis. The uptrend line that we spotted earlier today is continuing to tarmac the way to an even stronger bullish wave.
As shown on the 1 hour Bitfinex (BTC/USD) chart from tradingview.com (look at the below chart), we can notice the shape of the bullish wave that has been ignited on the 16th of January. We can see a repetitive pattern characterized by a bullish rally that is followed by a 50-70% downwards correction force. The price seems to be heading up to the $256 resistance especially that the price is now above the 20 hour moving average.
By studying the 1 day Bitfinex (BTC/USD) chart from tradingview.com and plotting the MACD and Bollinger Bands (look at the below chart), we can also spot further signs that signal continuation of the current bullish wave which include the following:
- Bitcoin price is now above the 20 day EMA, but it is still below the upper Bollinger Band. The upper Bollinger Band is one standard deviation above the 20 day EMA and whenever the current price touches it, this will indicate that bitcoin is overbought.
- The MACD blue line is continuing to crawl slowly towards the positive territory. At the time of writing of this article, the MACD values -1.0410 which rose from -2.4218 earlier today.
Conclusion:
Bitcoin price is continuing to advance steadily towards the $256 resistance level. It is safe now to open a long position at around $240 with a take profit between $256 and $260, while setting a stop loss level at $230.