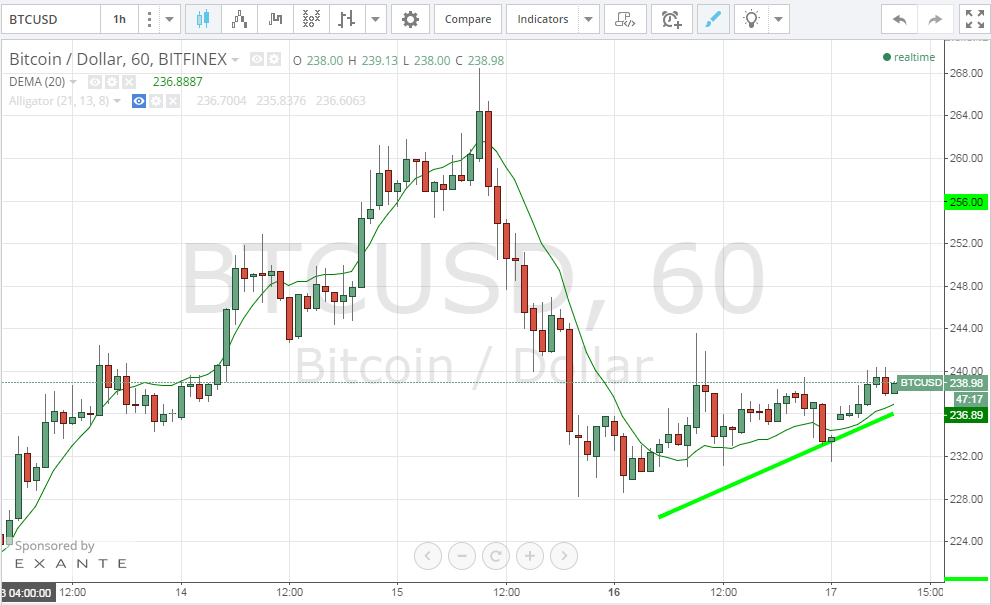
Bitcoin price remained above the $220 level yesterday, as the market’s bulls failed to push the price up to test the $256 resistance level.
By studying the 1 hour Bitfinex (BTC/USD) charts from tradingview.com, we can analyze the market’s pattern throughout yesterday’s trading sessions. We can summarize yesterday’s trading trend by the following repeating pattern “A burst of a 3 hourly bullish candles is followed by a bearish weaker wave that takes the price down to abolish 50-70% of the bullish wave”. The outcome of this pattern is an upward sloping trend line (look at the green trend line on the below chart) that seems to be pushing bitcoin price upwards to test the $256 resistance level within the next 24 hours or so.
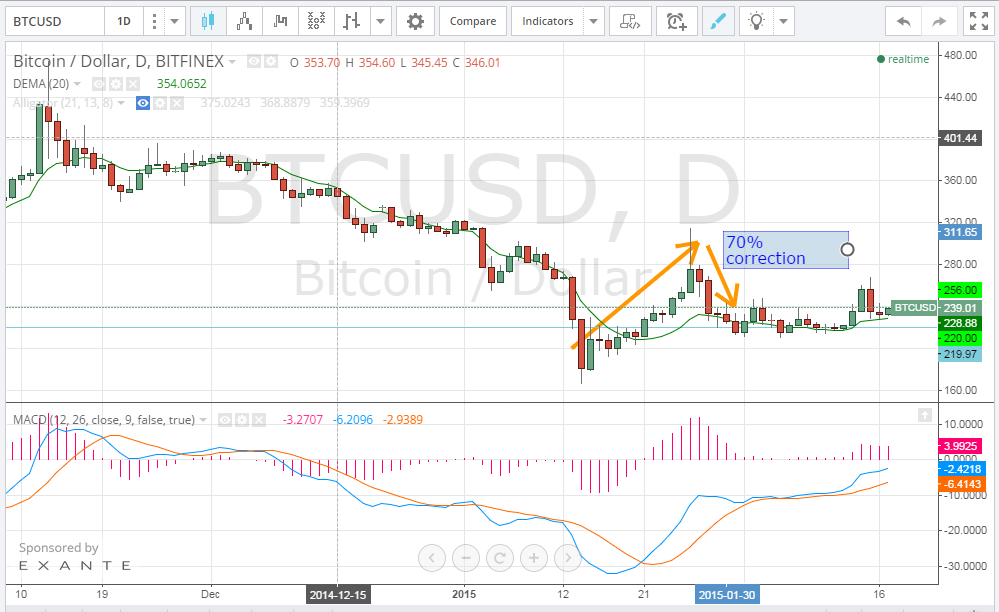
Let’s take a look at the 1 day Bitfinex (BTC/USD) charts from tradingview.com and plot the MACD indicator and the 20 day EMA accordingly. A bullish wave started on the 15th of January followed by a bearish wave that corrected the price to around 70% of the price gain. Since then, bitcoin price has been moving sideways highlighting strong support at the $220 level. The price now is above the 20 day EMA and a the MACD curve supports an upcoming bullish wave as shown by:
- The MACD blue line has crossed over the red signal line.
- The MACD indicator is sloping in an upwards direction.
- Although the MACD is still in the negative territory, it seems to be crawling slowly towards the positive territory, which would signal a strong bullish rally.
Conclusion:
Bitcoin price failed to rise up to test the $256 resistance yesterday. Our analysis is in favor of a bullish wave that would take the price up to $256 within the next 24 hours.
Charts from Bitfinex