Bitcoin price continued to rise yesterday scoring a high of $244. The pattern of the new bullish wave has been established as we explained during our yesterday’s “intraday tips” article.
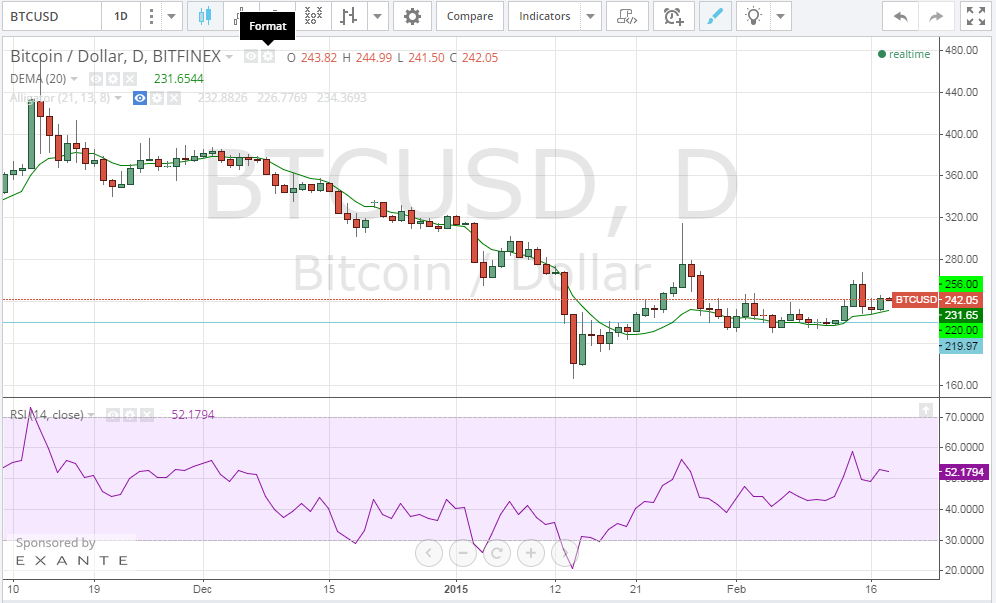
By analyzing the 1 day Bitfinex (BTC/USD) charts and plotting the RSI and the 20 day EMA accordingly (look at the below chart), we can conclude the following:
- The current bullish trend can be viewed as a continuation of the bullish wave that started on the 15th of January, if we consider that the first bullish rally had been halted by a price correction wave that triggered sideways movements for a few days, before the bulls took over the market again.
- The RSI is around 52 at the moment, so it is in a safe zone that supports continuation of the bullish rally. However, an RSI value near 70 would mean that bitcoin is overbought which would be a signal to stop investing in long positions.
- Bitcoin price is now trading at a level higher than the 20 day EMA, which is also in favor of continuation of the bullish wave.
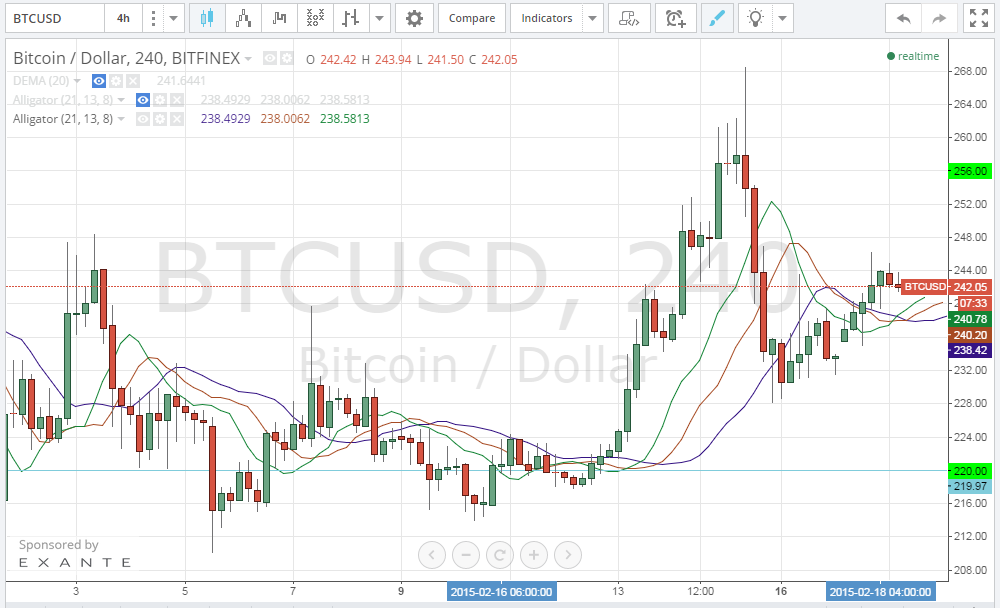
By observing the 4 hour Bitfinex (BTC/USD) chart and plotting the William’s Alligator indicator accordingly (look at the below chart), the bullish wave seems to be gaining momentum and is expected to continue pushing bitcoin price higher. The moving averages of the William’s alligator are exhibiting a perfect alignment that supports continuation of the current bullish wave. The red line (teeth) is in the middle, the green line (jaw) is on top and the blue line (lips) is below, so it seems that bitcoin price is advancing steadily towards the $256 resistance level.
Conclusion:
Bitcoin price is advancing steadily after reaching a high of $244 yesterday. Our technical analysis is in favor of continuation of this uptrend so that we can see the $256 resistance level tested soon enough.