Bitcoin price took a dive yesterday to reach a low of around $230.85 before heading upwards again to score a high of about $240.5 at the time of writing of this analysis.
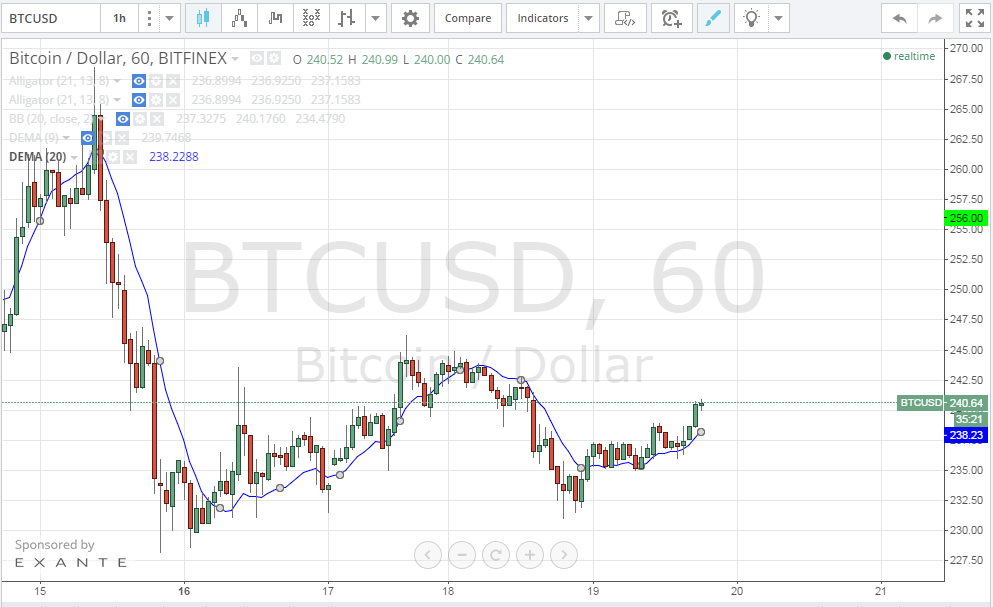
By studying the 1 hour Bitfinex (BTC/USD) charts from tradingview.com and plotting the 20 hour EMA (look at the below chart), we can notice that bitcoin price stopped falling at around $230, so we can see the support level rising gradually from the previous $220 level, which also proves that yesterday’s drop was nothing more than an attempt at price correction following the bullish wave that started on the 16th of January. This can also be proven by the fact that the downward price correction wave wasn’t strong enough to take bitcoin price to the low levels recorded on the 16th of January. Today’s upward wave was characterized by a repititive pattern characterized by a bullish rally forming 3 bullish candles on the 1 hourly chart, followed by 1-2 bearish candles. At the present moment, we can see 3 successive bullish candles and the price is above the 20 hour EMA curve. If the trading pattern leads to 4 successive bullish candlesticks, it is likely to see bitcoin price rise to test the $256 resistance level within around 24 hours.
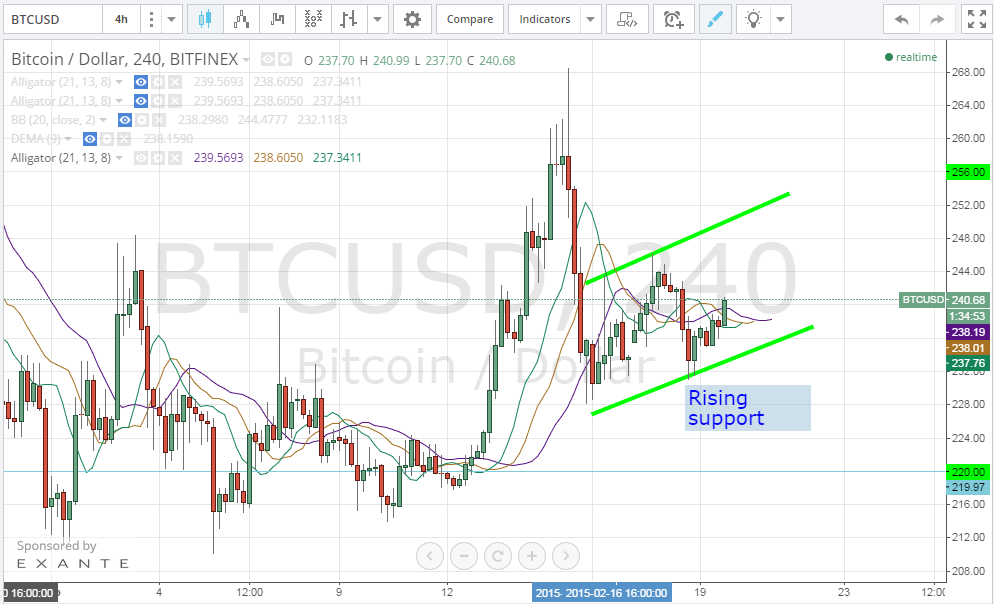
By studying the 4 hour Bitfinex (BTC/USD) charts from tradingview.com and plotting William’s Alligator indicator accordingly (look at the below chart), we can notice the following:
- The uptrend starting on the 16th of January is beginning to become more prominent as shown by the green trend lines on the following chart and the rising support level from $220 to around $230.
- The alignment of the moving averages of William’s Alligator indicator are still not perfect for a stronger bullish stampede, so if this changes within the next few hours, we can see higher values soon.
Conclusion:
Bitcoin price began rising today after falling yesterday. Rising support level is proving that we are yet to see the price reach higher levels.
Charts from Bitfinex