

Bitcoin Price Key Highlights
- Bitcoin price recently had a sharp selloff after testing a major resistance level visible on longer-term time frames.
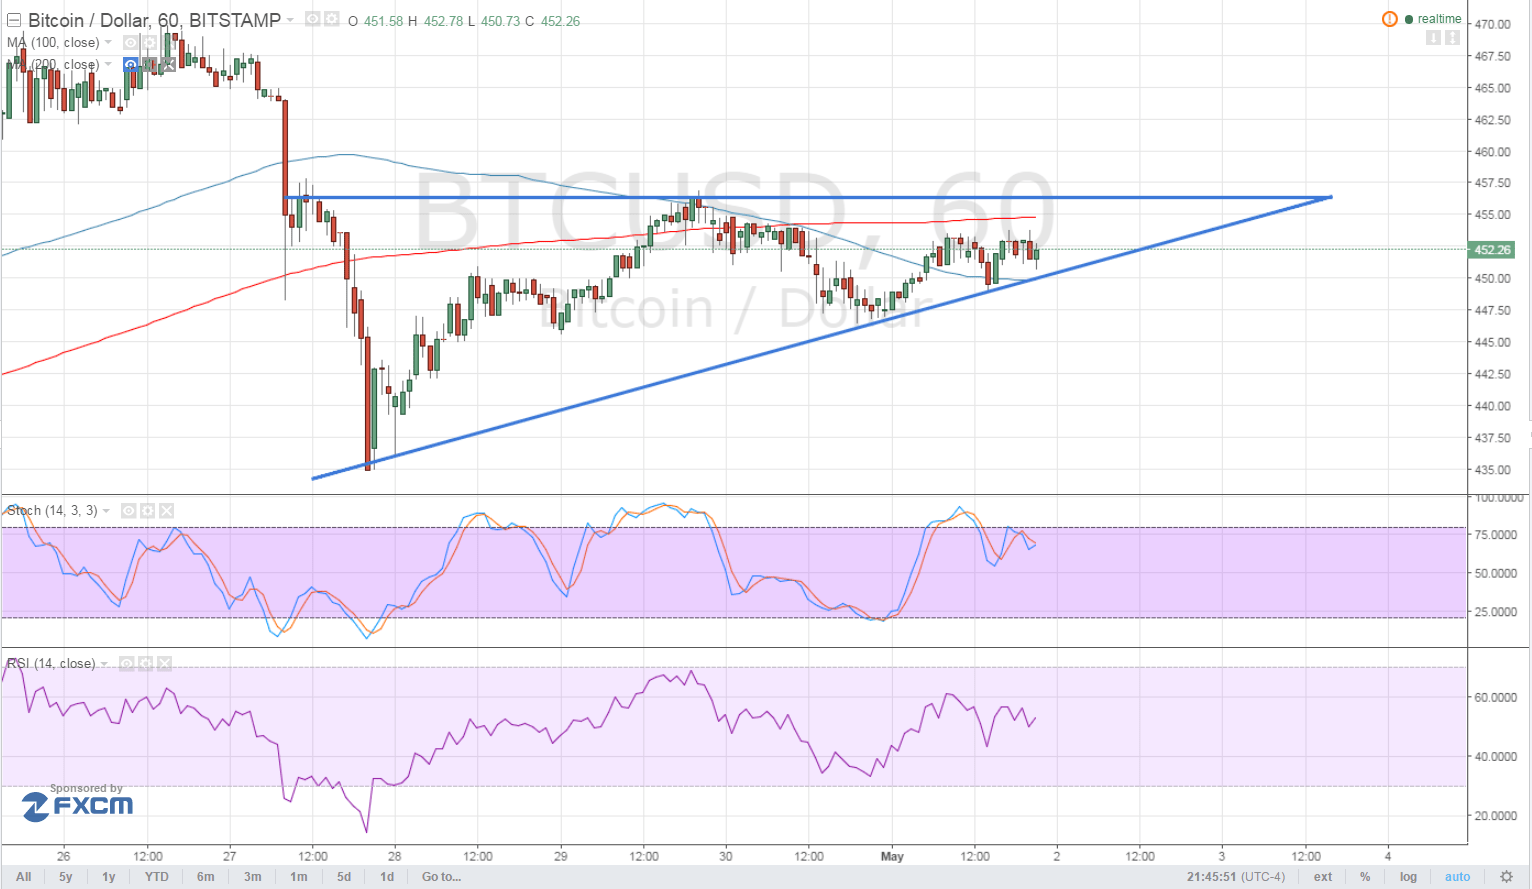
- Price bounced off the $435 area of interest and is consolidating at the moment, as buyers and sellers try to figure out where to take it next.
- Price formed higher lows and found resistance around $455, creating an ascending triangle pattern on the 1-hour time frame.
Bitcoin price could be due for a test of the short-term resistance but additional volatility could trigger a breakout in either direction.
Technical Indicators Signals
The 100 SMA is below the longer-term 200 SMA so the path of least resistance is to the downside. This means that a downside break from the consolidation pattern could be seen, taking bitcoin price on a longer-term selloff if a long red candle forms below $450.
In addition, stochastic is heading down from the overbought area so price might follow suit if bearish momentum continues to pick up. RSI is on middle ground but appears to be turning lower to show a return in selling pressure. After all, bitcoin came from a recent sharp drop so a continuation might be in order.
On the other hand, an upside break past the triangle resistance could spur another test of the major resistance around $470, with stronger bullish pressure paving the way for a sustained rally.

Market Events
Volatility was subdued on Friday, following the top-tier reports earlier in the week. The FOMC decided to keep interest rates unchanged as expected but refrained from providing any clues as to when they might hike again while the advance US GDP fell short of expectations with a 0.5% growth figure instead of the estimated 0.7% expansion.
Medium-tier data from the US came in mostly weaker than expected on Friday, which explains why the US currency lost ground to bitcoin price. The ISM manufacturing PMI is due today and the non-farm payrolls report is due at the end of the week, possibly giving the dollar a clearer direction then.
Charts from Bitstamp, courtesy of TradingView
Image courtesy of NewsBTC All Rights Reserved