Bitcoin price continued rising today and broke out of the $220 level to trade above $230 throughout most of the day. Today’s buying volume continues to confirm a strong bullish wave that will boost the value of bitcoin even more.
By plotting the “William’s Alligator” indicator on the 4 hour Bitfinex BTC/USD charts from tradingview.com (look at the below chart), we can observe new bullish signals. The Alligator indicator is laid out in a pattern that confirms a bullish uptrend:
- The blue line (jaws of the alligator) is at the bottom.
- The red line (teeth of the alligator) is in the middle.
- The green line (lips of the alligator) is on the top

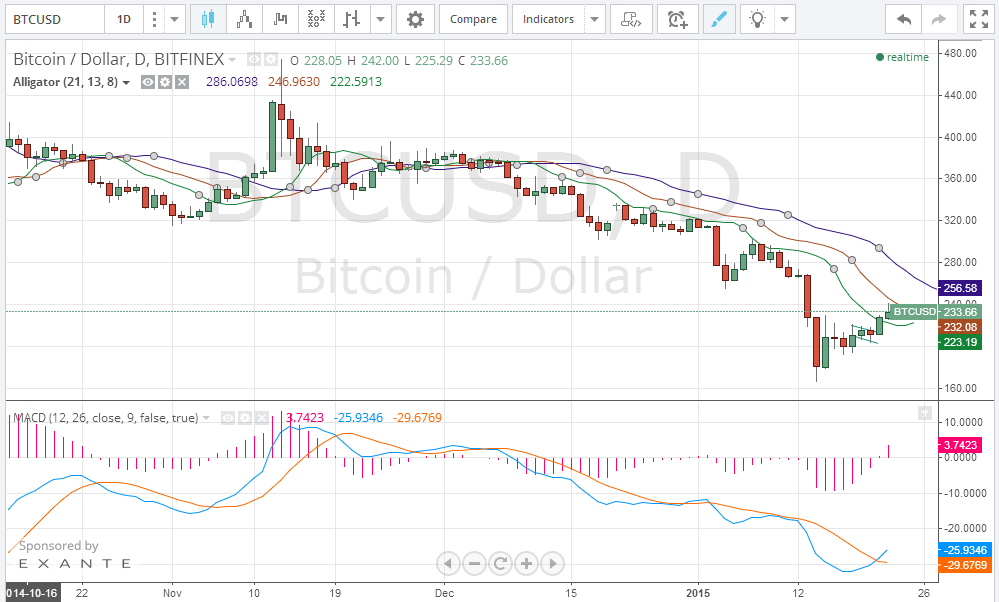
By analyzing the 1 day Bitfinex BTC/USD from tradingview.com (look at the below chart), we can easily see how the price is continuing to score higher highs every day. By plotting the MACD indicator on the same chart, we can observe that the short term moving average (blue line) has crossed over the long term moving average (red line), which confirms an upcoming increase in the price of bitcoin.
To sum up, our technical analysis proves that bitcoin price is rising towards the $256 resistance line according to the Fibonacci retracement fan lines. The price seems to increase during 4-6 hours bursts which are followed by longer periods of sideways price movement. After testing the $256 resistance line, reassessment is required to determine whether or not the new bullish trend will continue.
Charts from Bitfinex.