During the past 48 hours, we observed the sideways movement of bitcoin price, which reflects the market’s attempt to correct the price. As per our analysis yesterday, the bitcoin price was oscillating between $203-205 and $213-217 creating a slightly downward sloping trend line as the price is attempting to break out of the $220 resistance line.
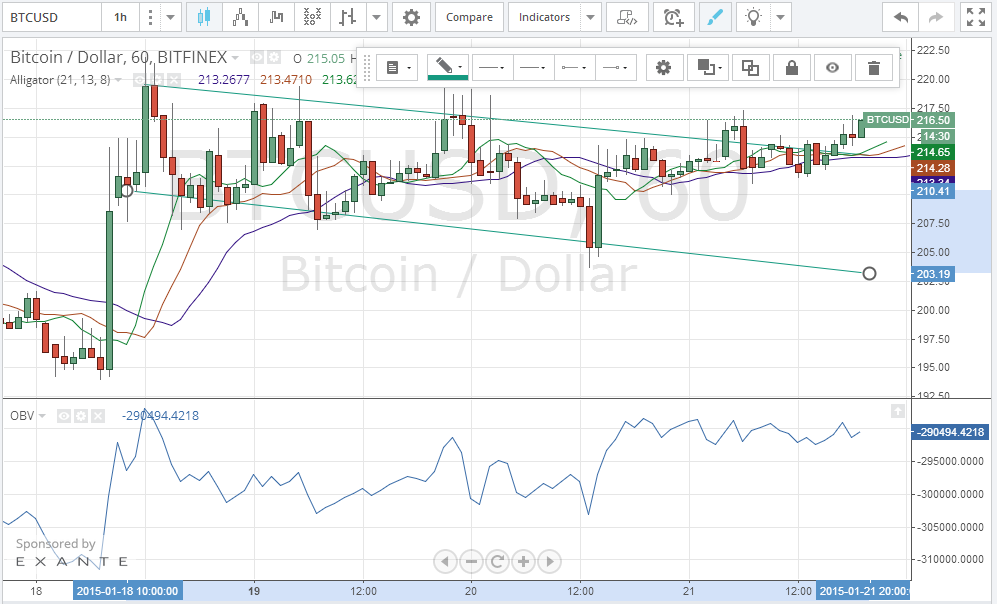
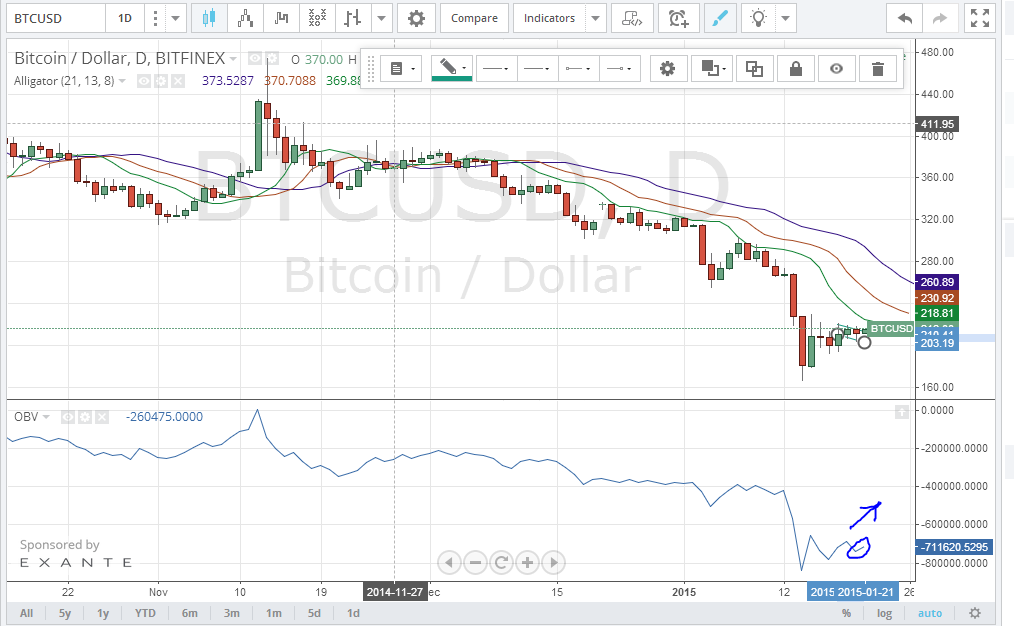
The day started with a rise in bitcoin price that broke out of the trend line we plotted yesterday on the 1 hour Bitfinex Bitcoin/USD chart (look at the above chart). At the time of writing of this article, the price reached $216, which is above the trend line. By plotting the On-balance volume (OBV) curve on the 1 day Bitfinex Bitcoin/USD charts, we can notice that the OBV curve is starting to slope in an upward direction (look at the blue circle and arrow on the below chart), which confirms an increase in the market’s buying strength and an upcoming bullish wave.
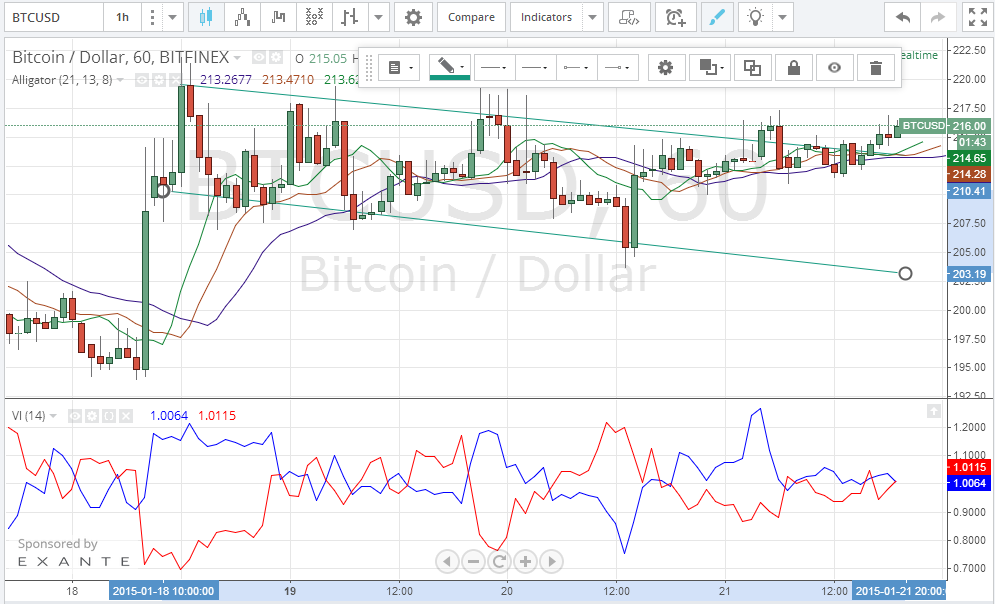
Breaking out of the $220 new resistance line will confirm a further rise to the $256 resistance point as shown by the Fibonacci retracement fan lines. By plotting the Vortex indicator (VI) on the 1 hour Bitfinex Bitcoin/USD charts (look at the below chart), we can observe that throughout the most of the day, the positive blue trend line was above the negative red trend line, with a wide gap between them, which illustrates the buying strength of the market. However, the gap between the two trend lines shrank a few hours ago and at the time of writing of this article, the gap disappeared. We are waiting to see the positive blue trend line crossing over the negative red trend line, before a bullish trend commences.