Bitcoin price continued to approach the $256 resistance level territory yesterday, recording a high of around $248 and a low of around $243. The low trading volume of yesterday’s market is the main reason why the price didn’t rise up to higher levels.
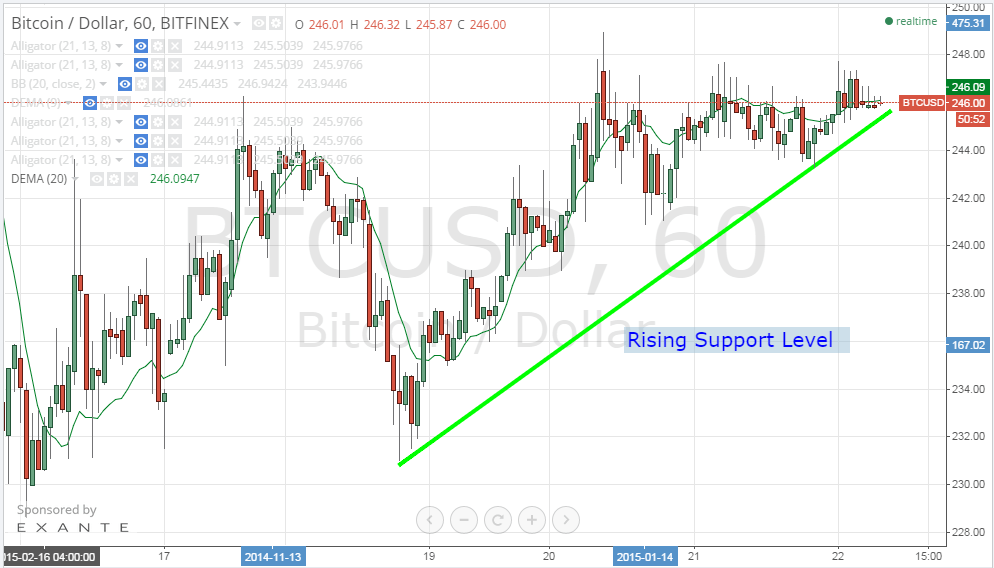
By studying the 1 hour Bitfinex (BTC/USD) charts from tradingview.com and plotting the 20 hour EMA (look at the below chart), we can notice the following:
- Bitcoin price has been trading yesterday outside the trend lines we plotted on our analysis on the 20th of January; however, the price remained to exhibit rising support levels as shown by the green trend line we depicted on the 1 hourly chart below.
- During most of yesterday’s trading sessions, bitcoin price has been trading below the 20 hour EMA. We ought to see the price rise above the 20 hour EMA if we are going to see a strong bullish wave push the price up to test the $256 resistance level.
- Bitcoin price has been moving sideways during most of yesterday’s trading sessions which proves the strength of resistance at the $256 level as the price approaches its territory.
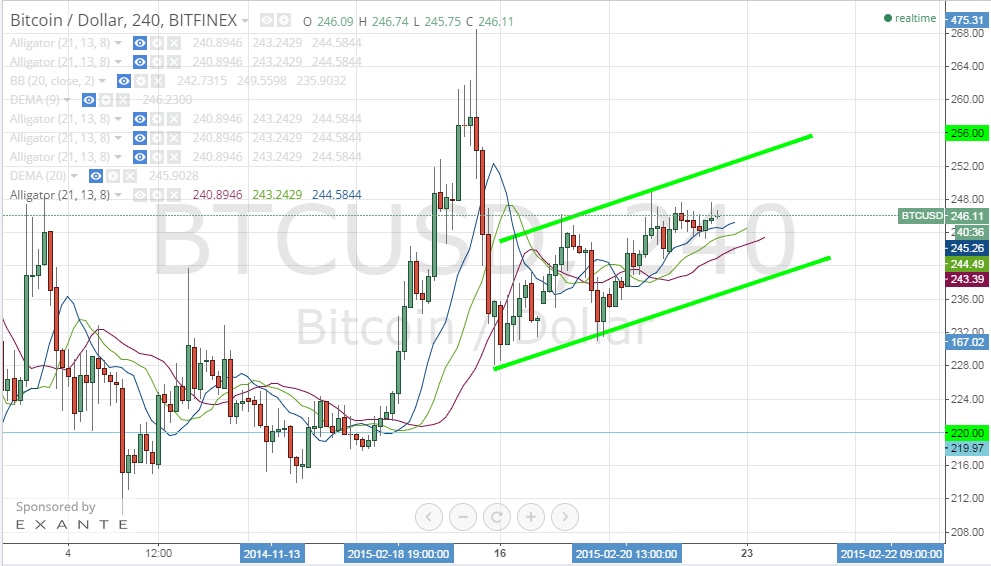
By studying the 4 hour Bitfinex (BTC/USD) charts from tradingview.com and plotting the William’s Alligator indicator accordingly (look at the below chart), we can conclude the following:
- Since the 16th of January, bitcoin price has been traveling across an uptrend line (look at the two green trend lines on the following chart), so we can see support rising and higher highs are recorded.
- William’s Alligator indicator moving averages are still not exhibiting a perfect alignment that can signal an upcoming strong bullish wave. This alignment has to change before we can see the price rise up to test the $256 resistance level.
Conclusion:
The bullish wave that controlled the market slowed down yesterday, so bitcoin price failed to rise to test the next resistance level. Our technical analysis during the past few days is in favor of a bullish wave that will push price up to $256 during the next couple of days.
Charts from Bitfinex