Bitcoin price continued skyrocketing to record a high of $267 earlier today, so the price is now well over the $256 level that resisted the bulls for a rather long time. It seems that bitcoin price will continue rising to the $300 level within the next few days.
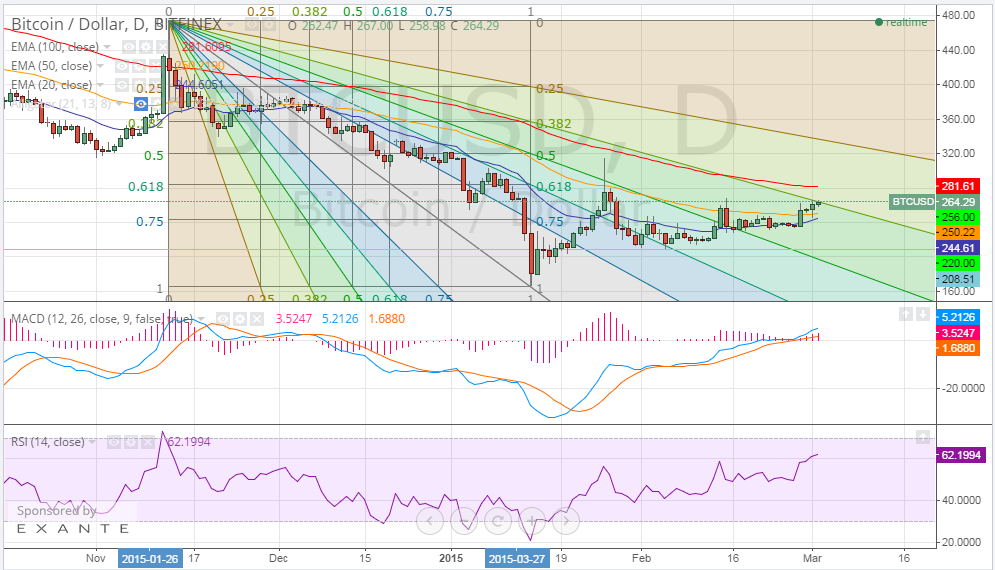
Let’s take a look at the 1 day Bitfinex (BTC/USD) charts from tradingview.com and plotting the MACD indicator and RSI. To better understand the new bullish trend, we will plot a Fibonacci retracement fan across a trend line that extends between the high reached on the 13th of November 2014 ($474.77) and the low reached on the 14th of January ($165.62) (look at the below chart). We can notice the following:
- Bitcoin price has just broke through the 38.2% Fibonacci retracement fan level and bitcoin is now trading at a price greater than the 20 and 50 day EMAs.
- According to the new Fibonacci retracements, bitcoin price will face resistance at $284 and $320 which correspond to the 61.8% and 50% retracement levels respectively. If the price continues to be above the 38.2% Fibonacci retracement fan level, we are likely to see it increase to test the $284 level within the next 24 hours.
- The MACD indicator’s value is now in the positive territory and the blue MACD line is higher than the red signal line, so the bullish wave is likely to continue pushing the price to higher levels.
- The RSI value is now around 61 and there is space to allow bitcoin price increase even more. However, if the RSI exceeds 70, this can signal reversal of the bullish wave.
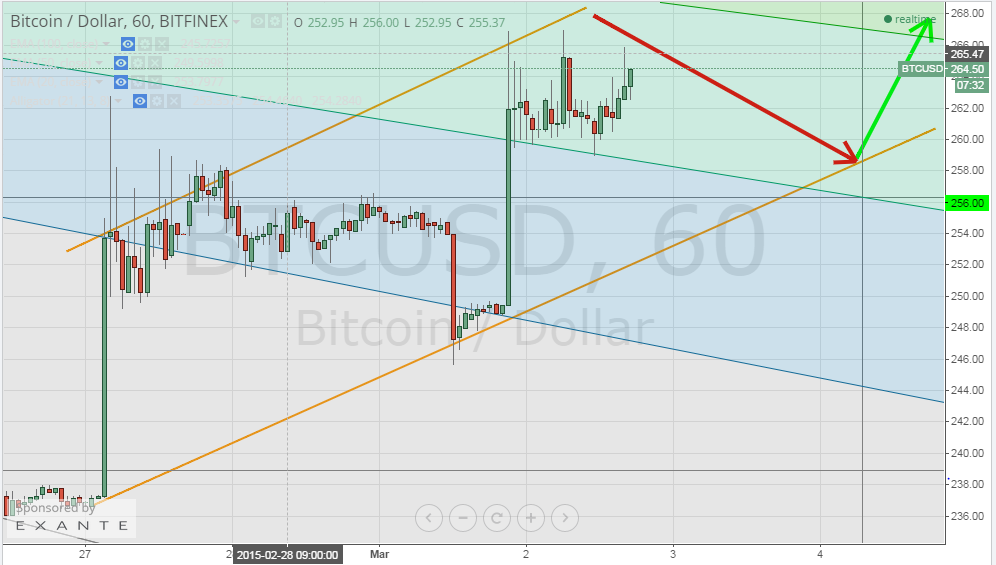
By studying the 1 hour Bitfinex (BTC/USD) chart from tradingview.com and keeping the Fibonacci retracement fan we plotted earlier (look at the below chart), we can spot the new bullish trend as shown by the two orange trend lines on the below chart. Accordingly, we can notice a rising support level and higher highs recorded repeatedly and we can see the price correct down to around $258 before rising up again.
Conclusion:
Bitcoin price continued rising yesterday. Our technical analysis predicts that bitcoin price will continue rising to $284 within the next 24 hours.
Charts from Bitfinex