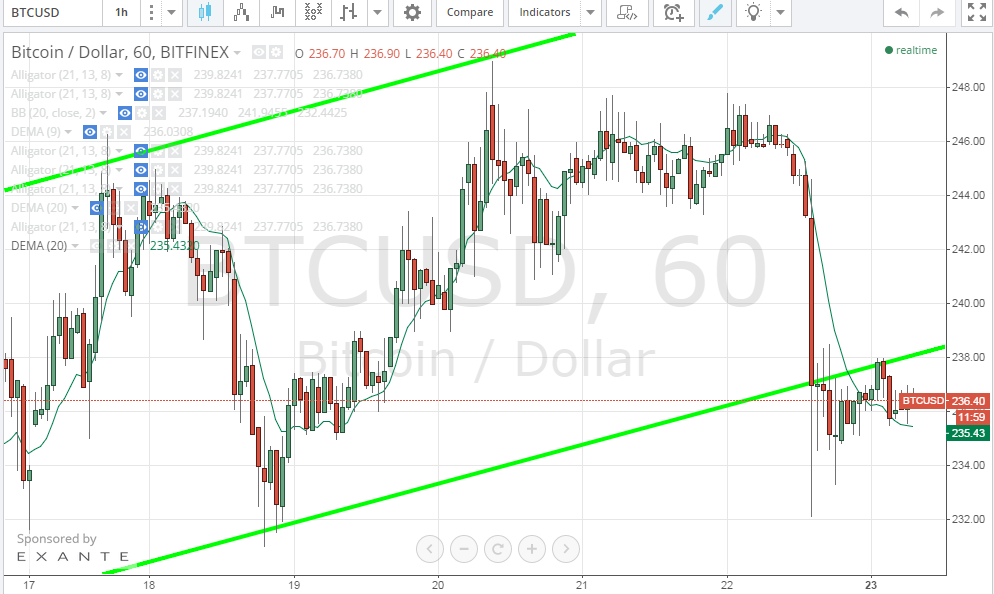
Bitcoin price exhibited a deep dive yesterday to reach a low of around $232 to fall just below the new trend line that we spotted during yesterday’s analysis.
By studying the 1 hour Bitfinex (BTC/USD) charts from tradingview.com, plotting the 20 hour EMA and extending the trend lines we plotted on the 4 hour charts during yesterday’s analysis (look at the below chart), we can conclude the following:
- Bitcoin price dropped yesterday from $243 to around $232 during the 12:00 GMT hourly trading session to fall below the new trend line. Earlier before this drop, the price was well below the 20 hour EMA.
- The long shadows of the candlesticks that followed this drop points to the fact that the new trend line is resisting further price decline.
- Bitcoin is trading around $236, at the time of writing of this article. The following few hours will reveal whether or not yesterday’s decline was just an overshoot below the new support level.
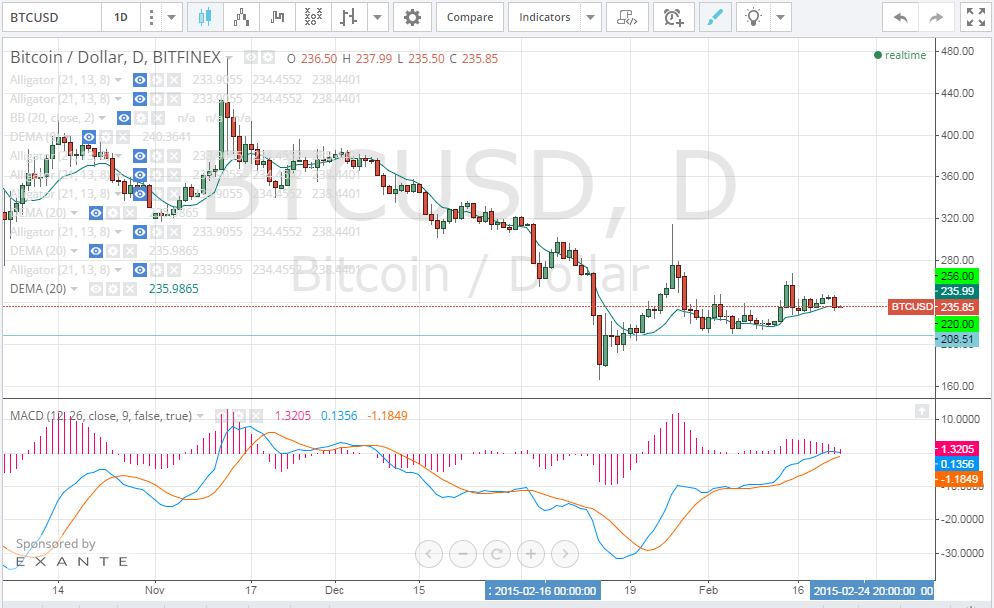
By studying the 1 day Bitfinex (BTC/USD) chart from tradingview.com, plotting the 20 day EMA and calculating the MACD indicator accordingly (look at the below chart), we can notice that despite yesterday’s decline, bitcoin price is now above the 20 day EMA. The MACD blue line has crossed above the red signal line; however, the value of the MACD indicator is in the negative territory. If the value of MACD enters the positive territory and the blue MACD line remains above the red signal line during the next few hours, we can see bitcoin price rise again.
Conclusion:
Bitcoin price suffered a steep decline yesterday to score a low of $232 to drop just below the new trend line. If the price rises up above the $238 within the next few hours, we can see it heading up to the $256 resistance level again.
Charts from bitfinex