Bitcoin price continued rising, emphasizing the bullish wave that started earlier this week. Yesterday, the price pushed upwards until it touched the $256 resistance line.
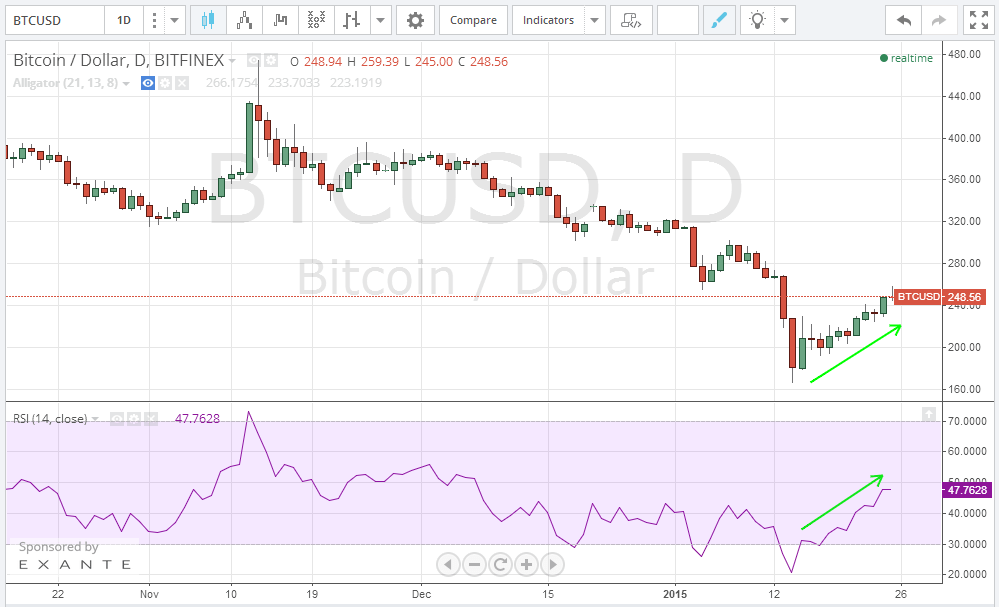
The price reached a high of around $259 yesterday, before falling to $249 at the time of writing of this article. Basic and technical analyses are in favor of continuation of the bullish trend to push the price even higher. By studying the 1 day Bitfinex (BTC/USD) charts from tradingview.com, we can notice a reversal of the bearish trend on the 14th of January. By plotting the Relative Strength Index (RSI) on the same charts (look at the below chart), we can observe an upward sloping RSI which is synchronizing with the current price movement. Lack of a bearish divergence using RSI analysis of the trading charts of the past 14 days indicates that the price is likely to continue rising throughout the next few days.
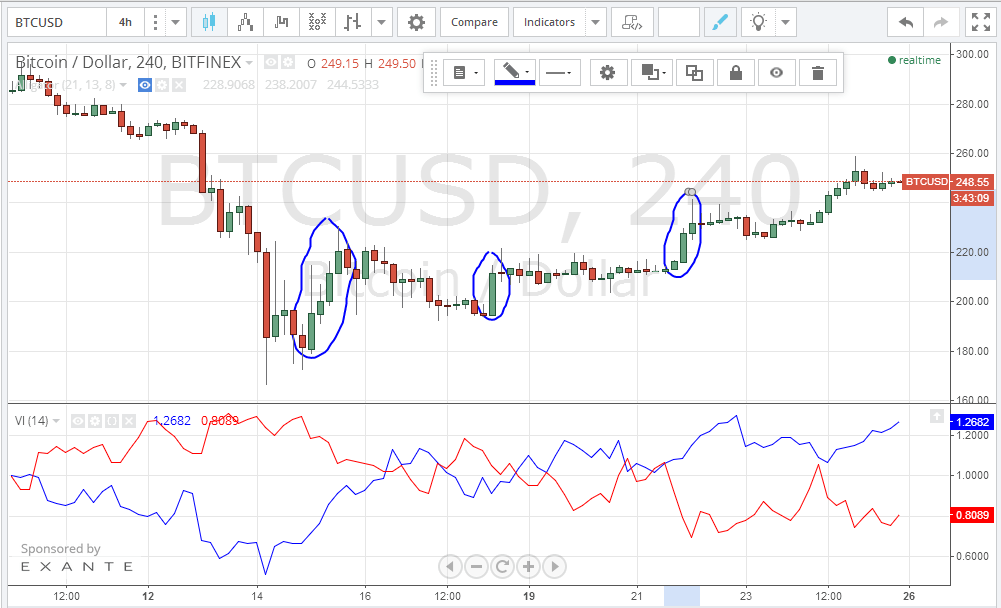
By studying the 4 hour Bitfinex (BTC/USD) charts from tradingview.com, we can observe how the price has been exhibiting bullish bursts that last a few hours, followed by longer periods of slight decline (look at the green candles inside the blue clouds on the below chart). By plotting the Vortex Indicator (VI) on the same charts, we can notice that the positive (blue) uptrend line is still above the negative (red) downtrend line which confirms continuation of the bullish trend. As the gap between the 2 trend lines of the VI is relatively wide, we can confirm the current buying strength of the market.
If the $256 resistance line is broken during the next few days, we can soon see the price rising to approach the $300 resistance line.
Charts from Bitfines