- Yesterday, bitcoin price ranged between $235.5 and $239.33. Although bitcoin has been trading between $235 and $240 throughout the past few days, it seems that we will see it break out of this range soon.
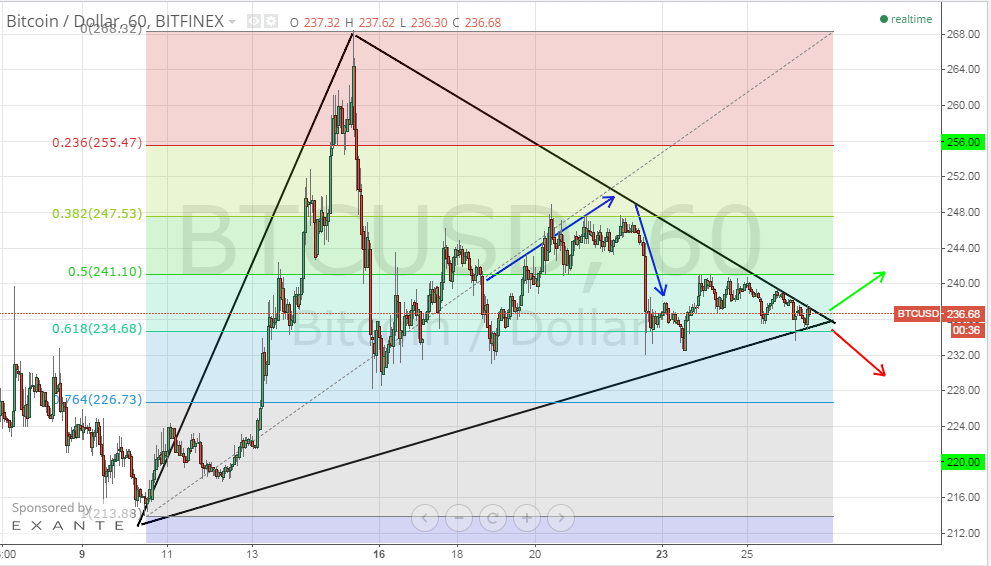
By studying the 1 hour Bitfinex (BTC/USD) charts from tradingview.com, drawing a trend line between the low reached on the 10th of February ($214) and the high reached on the 15th of February ($268) and plotting the Fibonacci retracement levels accordingly (look at the below chart), we can better understand the current market trends and we can also conclude the following:
- As shown by the 3 black lines on the below chart, bitcoin price has been forming a “triangle-like” pattern as the price continued to fall after the 15th of February while maintaining a relatively stable support level at around $232. The price bounced off the upper side of the triangle coinciding with the 38% Fibonacci retracement level on the 22nd of February as shown by the two blue arrows on the below chart.
- At the moment, the triangle pattern is almost complete and bitcoin price is about to break out to the bullish or the bearish side.
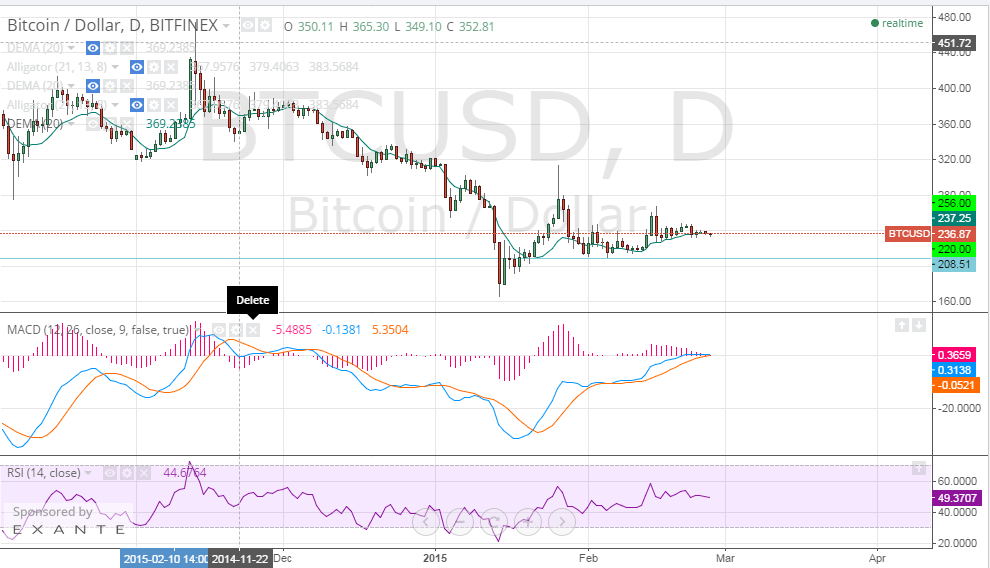
By analyzing the 1 day Bitfinex (BTC/USD) chart from tradingview.com and plotting the RSI and MACD indicator accordingly (look at the below chart), we can notice the following:
- The RSI value is around 49 now, so we can’t use the RSI to decide whether the price will go to the bullish side or not after breaking out of the triangle pattern we plotted earlier.
- The MACD indicator’s value is around -0.3, yet the blue MACD line has crossed above the red signal line. If the MACD indicator’s value enters the positive territory soon, this can be a signal that bitcoin price will head to the bullish side during the upcoming 24 hours.
Conclusion:
Bitcoin price is breaking out of the trend that has been controlling the market over the past few days. It is not unclear now whether or not the price will rise towards the $256 resistance level. Further analysis is mandatory to predict the upcoming trend pattern.
Charts from Bitfinex