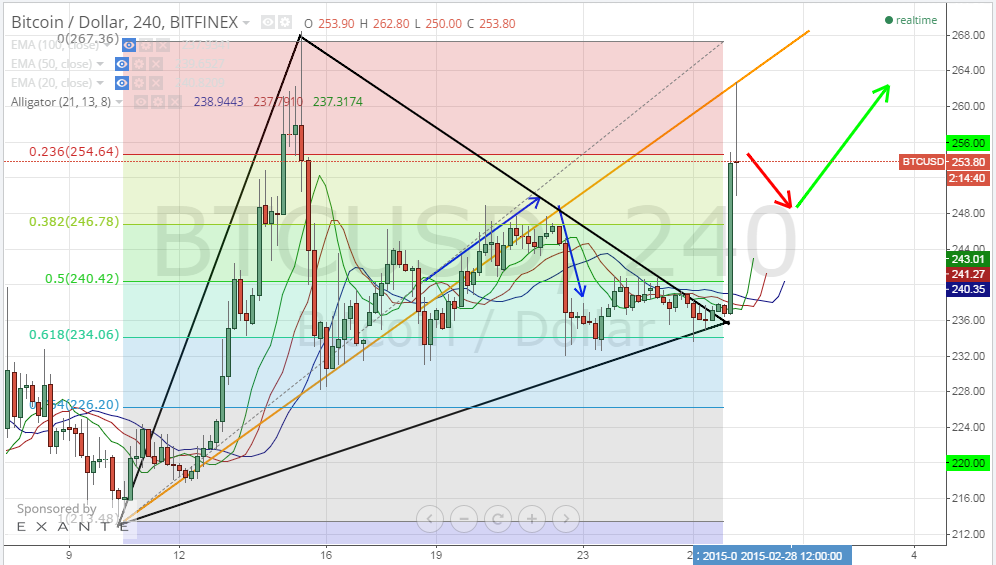
Bitcoin price started rising earlier today to record a high of around $262.38 and break out of the $256 resistance level. Just like we anticipated during yesterday’s analysis, bitcoin price has started a new bullish trend after completing the “triangle” pattern that controlled the market during the past couple of weeks.
By studying the 4 hour Bitfinex (BTC/USD) charts from tradingview.com, keeping the Fibonacci retracements & triangle trend line we plotted during yesterday’s analysis and calculating the William’s Alligator indicator (look at the below chart), we can conclude the following:
- Bitcoin price increased above the resistance level at $254.64 that coincides with the 23.6% Fibonacci retracement level before dropping below it during the next trading session.
- The alignment of the moving averages of the William’s Alligator indicator is perfect for continuation of the bullish wave; blue (lips) below, red (teeth) in the middle and green (jaw) on top. Keep an eye for a change in this alignment which would signal slowing down or reversal of the bullish wave.
- After testing the $254.64 resistance level, it is likely to see the price drop down to an average of 50% of the gained rise at around $246 before rising up again to retest the $254.64 resistance level.
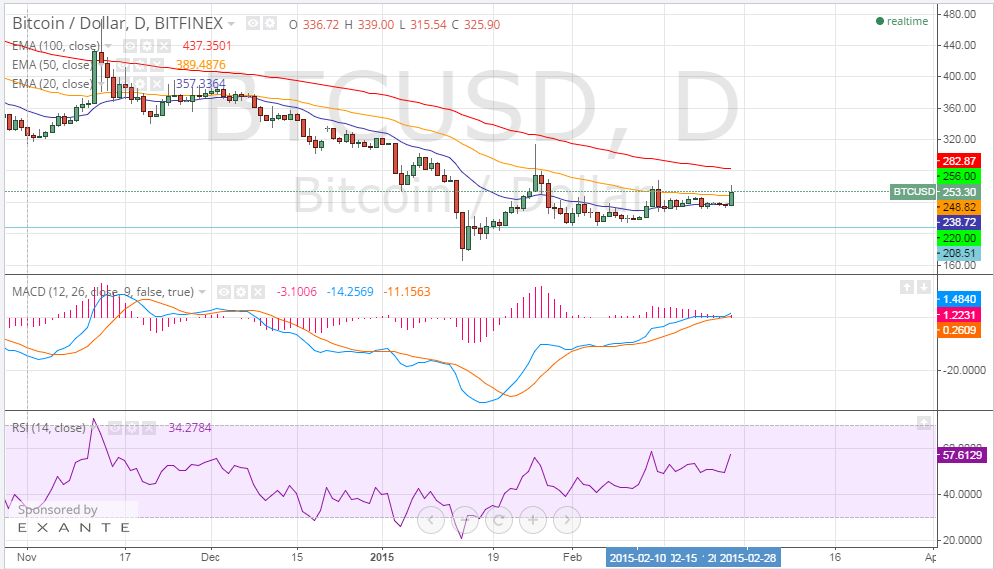
By examining the 1 day Bitfinex (BTC/USD) charts from tradingview.com, plotting the 20, 50 & 100 day EMAs, calculating the MACD indicator and executing the RSI (look at the below chart), we can notice the following:
- After today’s bullish rally, bitcoin price is now above the 20 and 50 day EMAs and if it remains so, we can see it rise to higher levels.
- The MACD indicator has entered the positive territory and the blue MACD line has just crossed above the red signal line, so we expect to see the bullish wave continue on to push the price even higher.
- The RSI’s value is around 58 so there is no sign denoting that bitcoin is currently overbought which also means that the bullish wave will continue on.
Conclusion:
Bitcoin price exhibited a bullish wave that pushed it to a high of $262.38 earlier today. Our technical analysis is in favor of continuation of this bullish wave to attempt testing the next resistance level at around $267.
Charts from bitfinex