Bitcoin price fell to test the $230 support line yesterday, yet the $230 line seems to support the price well, as the price started rising again after testing the $230 support line to score around $237 at the time of the writing of this article.
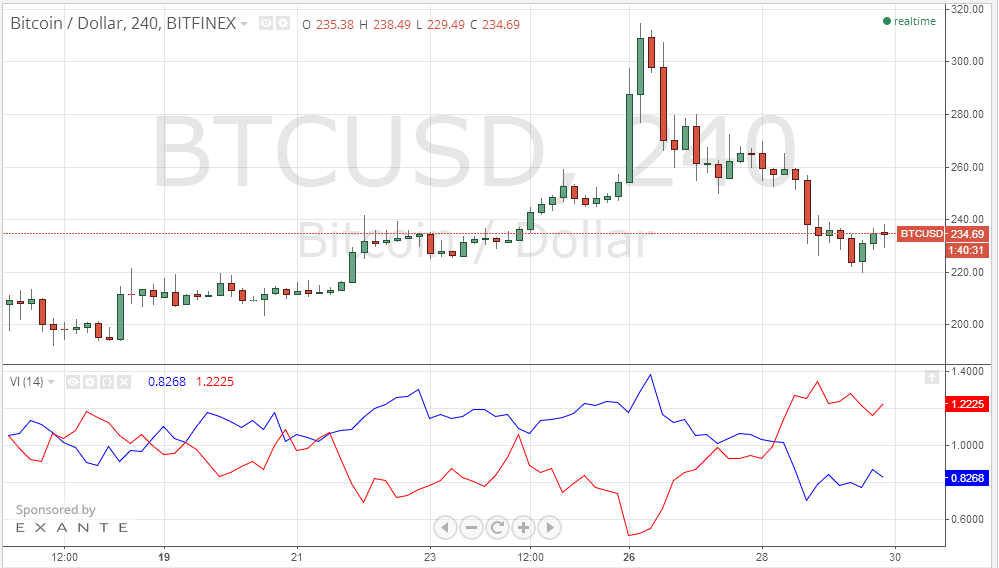
By studying the 4 hour Bitfinex (BTC/USD) chart from tradingview.com and plotting the Vortex Indicator (VI) (look at the below chart), we can notice that the red downtrend line is still above the blue uptrend line, which is synchronizing with the current bearish trend. Reversal of the bearish trend will be inevitable when we can see:
- 4 or more successive bullish open candles on the 1 hour charts
- The blue uptrend line crosses over the red downtrend line of the Vortex Indicator (VI) of the 4 hour charts.
- The On-balance volume (OBV) starts to slope upwards on the 1 day charts, before we can see an observable increase in the price of bitcoin reflecting an increase in the buying power of the market.
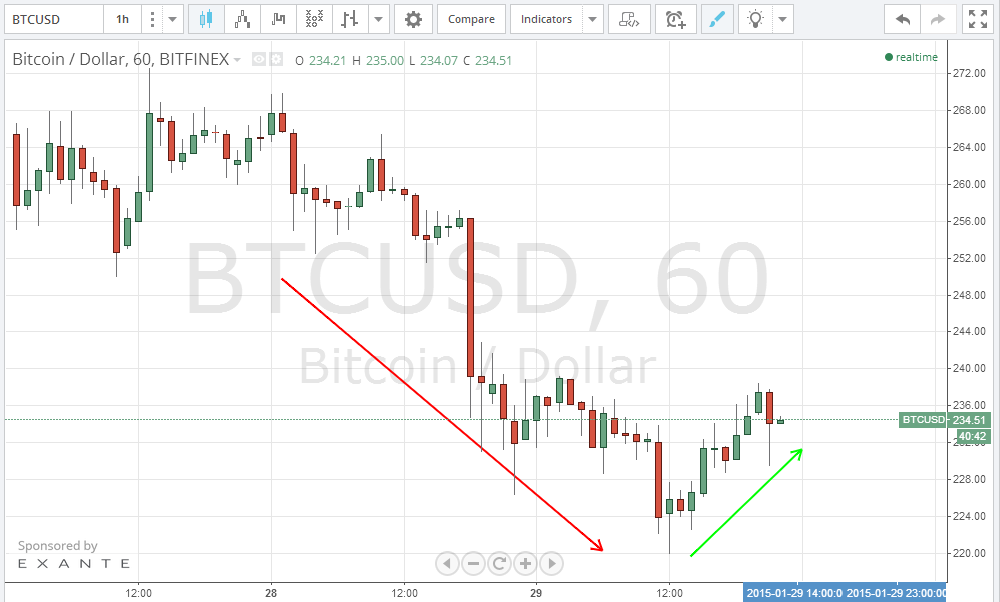
By observing the 1 hour Bitfinex (BTC/USD) charts from tradingview.com (look at the below chart), we can notice that the bitcoin price stopped falling after reaching levels near the $230 support line. The long shadow of the candlestick at 12:00 today reflects how the $230 support line is preventing the price from dropping further.
Although bitcoin price continued falling yesterday, we still believe that the near future will show a reversal of the recent bearish trend; yet, investing in long positions should be adjourned until we can see confirmation signals of a bullish wave.