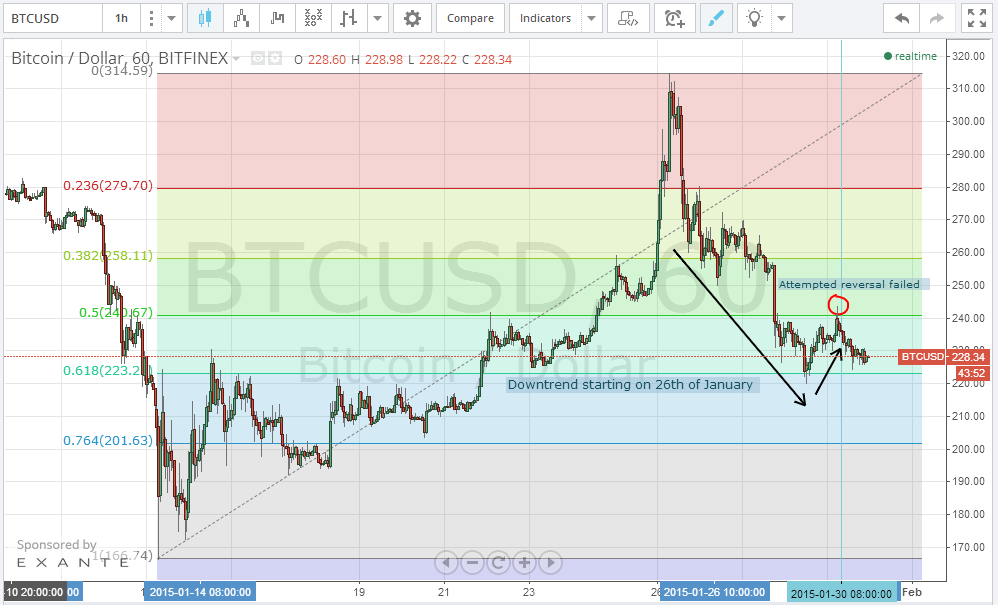
We spotted yesterday what seemed to be an attempt at reversing the current bearish trend, as bitcoin price was well supported at the $220-$230 level; however, the attempted reversal was resisted shortly and the price began to fall again after reaching a high of around $243.
By drawing a trend line between the low reached on the 14th of January ($165.82) and the high reached on the 26th of January ($315) on the 1 hour Bitfinex (BTC/USD) charts from tradingview.com, and then plotting the Fibonacci retracements accordingly (look at the below chart), we can see how the downtrend that had started on the 26th of January seemed to have been halted as the price touched the 61.8% retracement level at $220-$230. Afterwards, the price started rising until it exceeded $240 at the 50% retracement level (red circle on the below chart), which resisted further increase.
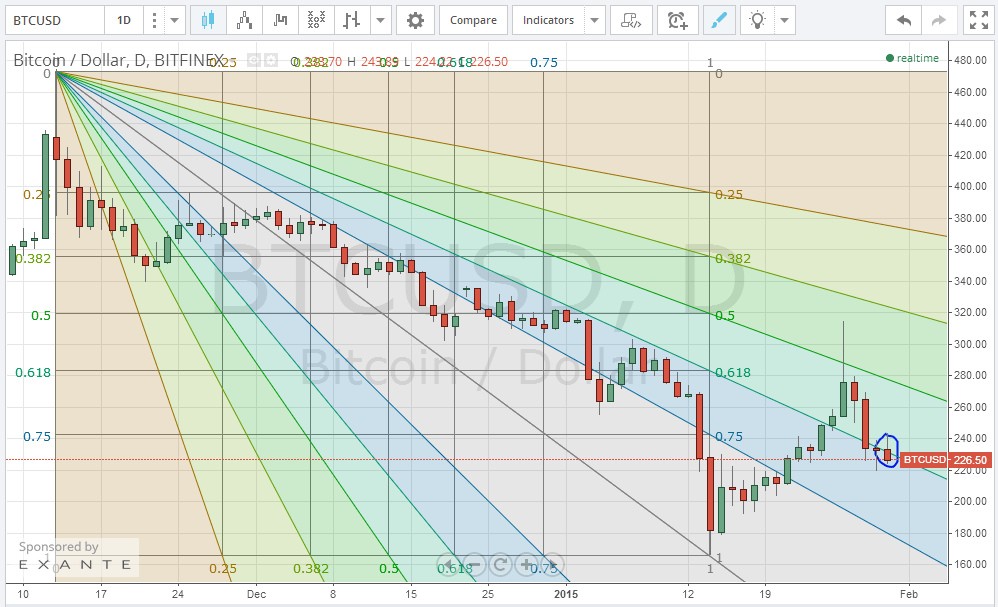
By plotting the Fibonacci retracement fan on the 1 day Bitfinex (BTC/USD) charts between the high reached on the 13th of November, 2014 ($473.13) and the low reached on the 14th of January, 2015 ($165.82) (look at the below chart), we can see that the price is currently touching the 61.8% Fibonacci retracement fan line. Accordingly, the current price shows much support as illustrated by Fibonacci retracements across 2 trend lines:
- The bullish trend line between $165.82 and $315
- The bearish trend line between $473.13 and $165.82
Conclusion:
By combining conclusions from our analysis with data concluded from market depth charts from Bitfinex and Cryptsy, it seems that bitcoin price is not likely to fall below $220 now, as entailed by big exchanges’ order books at the moment.
It’s one of those times when the strength of bitcoin is highly determined by its true believers who will continue to hold on to their currency no matter what, as the market continues filtering out speculators and seasonal traders.
Charts from Bitfinex