Bitcoin price continued rising as the market’s buying volume is increasing constantly. A high of around $280 was printed earlier today and if the current bullish momentum continues and bitcoin price exceeds $284, it will face no considerable resistance on its way up to $320.
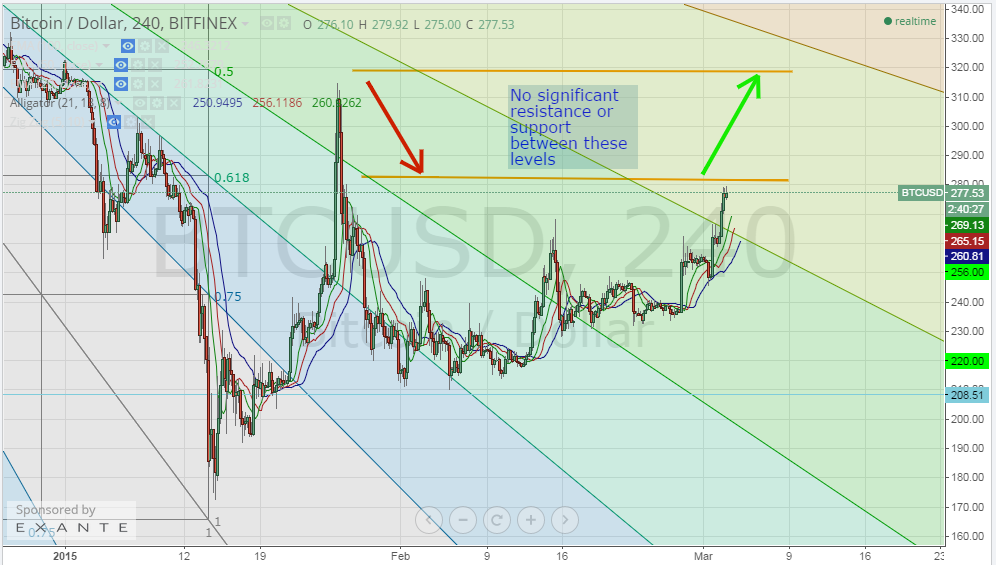
By studying the 4 hour Bitfinex (BTC/USD) charts from tradingview.com, keeping the same Fibonacci retracement fan we created during yesterday’s analysis and plotting the William’s Alligator indicator accordingly (look at the below chart), we can notice the following:
- Bitcoin price is continuing to record higher highs as it broke through the 38% Fibonacci retracement fan level and is now heading to $284 which corresponds to the 62% Fibonacci retracement level.
- If bitcoin price rises above $284 within the next few hours, it will inevitably reach the $320 level as there is no significant resistance between the 50% and the 62% Fibonacci retracement levels as proven by the price transformation on 25-26 January.
- The moving averages of the William’s Alligator indicator are still exhibiting a “bullish alignment” as the 21 SMA (lips) is below the 13 SMA (teeth) and the 8 SMA (jaw) is above both. Given the high sensitivity of the William’s Alligator indicator in detection of bullish waves, we expect the current bullish waves to continue pushing the price past $300 within the next 48 hours.
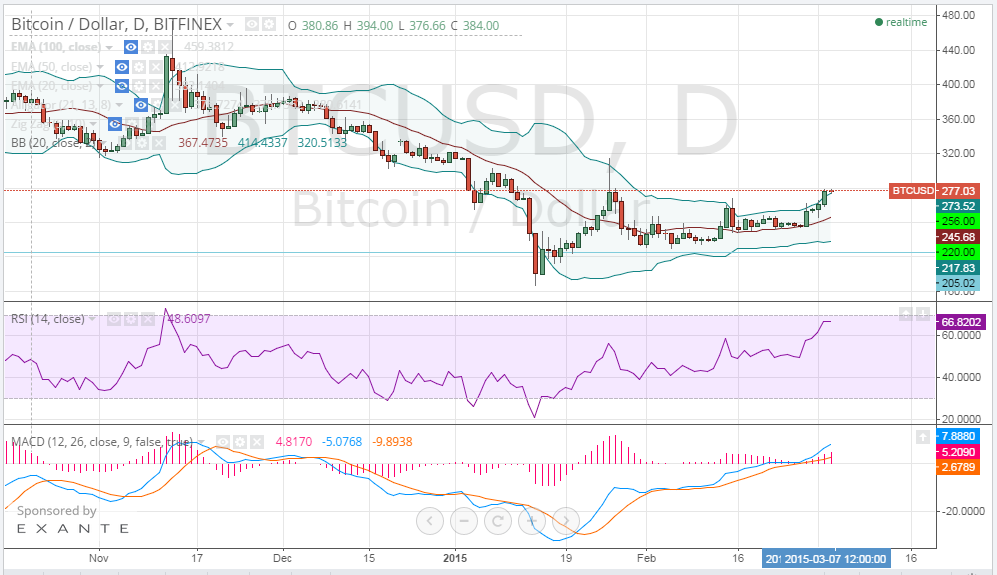
By studying the 1 day Bitfinex (BTC/USD) charts from tradingview.com, charting the Bollinger Bands and plotting the RSI and MACD indicator (look at the below chart), we can notice that the price has now risen above the upper band which might mean that the market is overbought. This predicts slowing down of the bullish wave, especially because the RSI value is close to 70. Accordingly, care must be taken to detect other signs that can signal slowing or even reversal of the bullish trend.
Conclusion:
Although there are signs signaling slowing down of the bullish trend, the buying power of the market can still push the price to higher levels. If the $284 resistance is broken, the $320 target level will be almost imminent within the next 48 hours.
Charts from Bitfinex