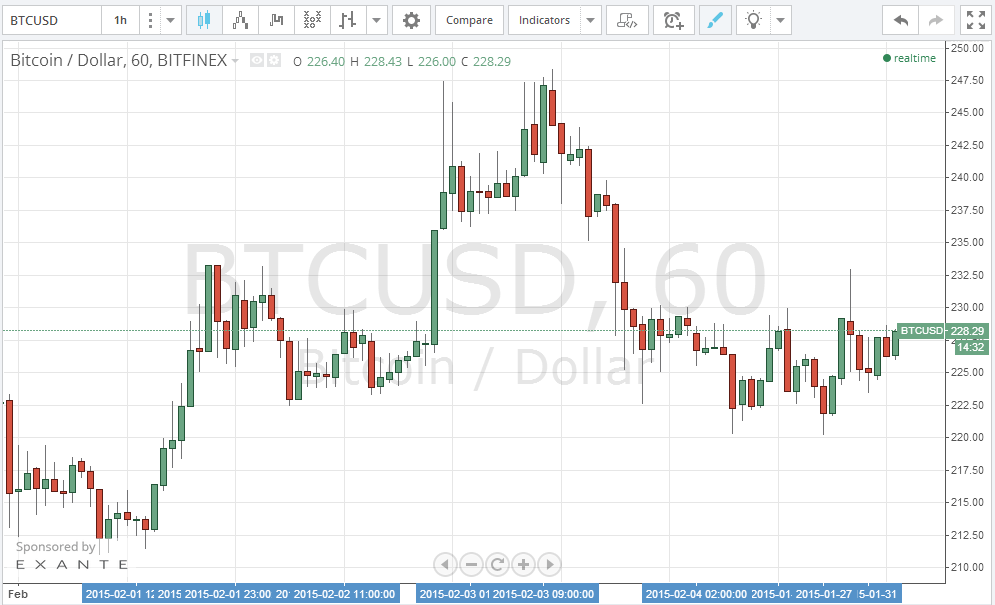
Bitcoin price exhibited sideways movement as we approach the $200 support level. Although chart analysis is in favor of a price advance in the near future, low trading volumes and uncertainty of traders has led to today’s sideways price movement.
By looking at the 1 hour Bitfinex (BTC/USD) charts from tradingview.com (look at the below chart), we can notice the sideways movement of bitcoin price during today’s trading hours. The price seemed to oscillate between $220 and $230 without a definable trend. The low trading volume today reflects uncertainty of a large percentage of traders who prefer to delay investing in long positions until charts are more meaningful.
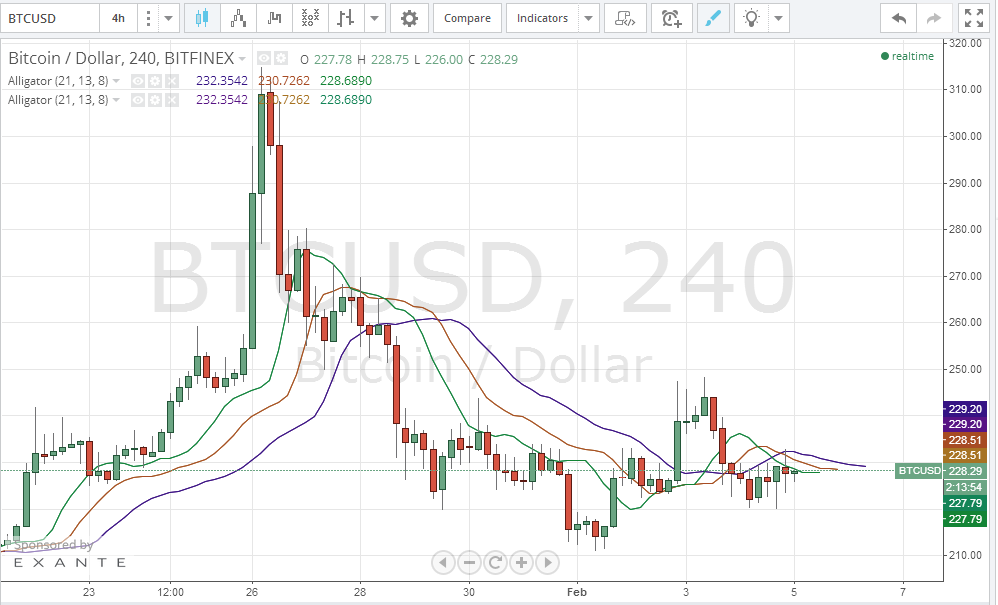
The bullish wave that we spotted on the 2nd of February failed to continue driving the price higher; however, bitcoin price seems to have strong support at the $220 level so we are not likely to see the price fall below that level during the next few days. By plotting the Willam’s Alligator Indicator on the 4 hour Bitfinex (BTC/USD) charts from tradingview.com, we can see that the green line (jaw) is below the red line (teeth) which is below the blue line (lips); accordingly, as shown by the William’s Alligator Indicator, conditions are not in favor of investing in long trading positions now. We must see the green line (jaw) above the red line (teeth) and the blue line (lips) below the red line (teeth) before we can see a bullish rally.
Conclusion:
Bitcoin price is moving sideways which reflects an overwhelming market uncertainty. The bullish wave that started 2 days ago is now pending, but we may see it drive the price up soon.
Images from Bitfinex