Bitcoin price decided to go bearish again today, losing around 10% to drop to around $214 at the time of the writing of this article. Indecisiveness in yesterday’s market has driven the price down near the $200 resistance level.
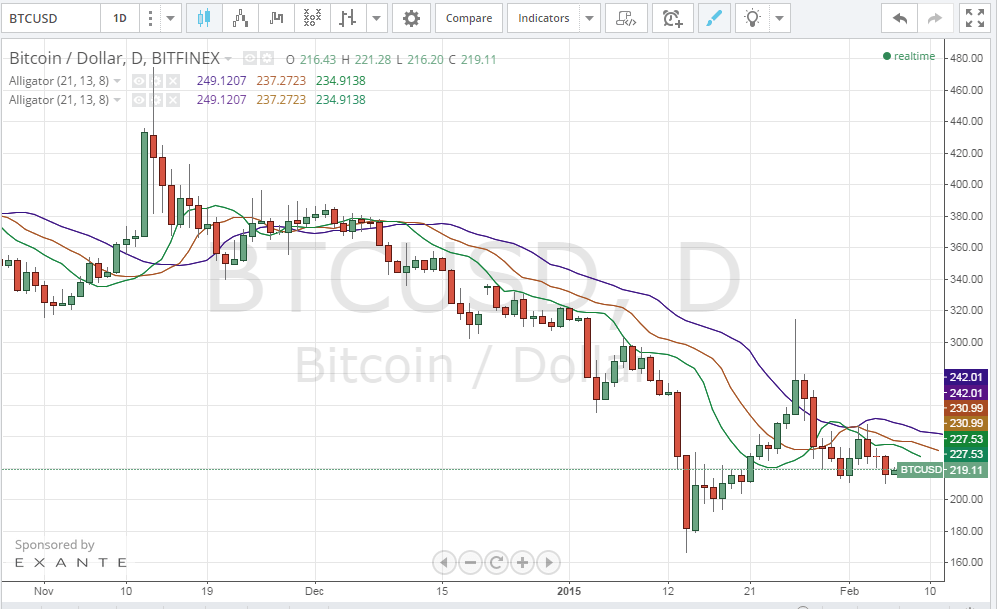
By looking at the 1 day Bitfinex (BTC/USD) charts from tradingview.com (look at the below chart), we can notice that the upward trend that started on the 15t of January reversed on the 26th of January after pushing the price up to more than $300. Although the price was well supported by the $220 level during the past few days, it seems that this level failed to support the price as we saw it dip below $220 during most parts of the day.
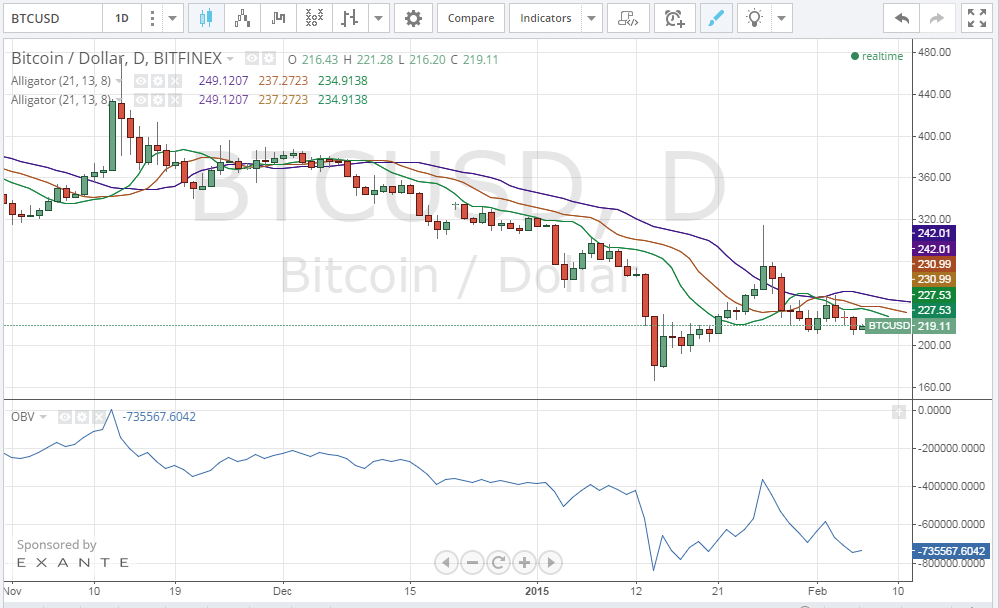
By plotting the On-balance Volume oscillator on the 1 day Bitfinex (BTC/USD) charts from tradingview.com (look at the below chart), we can see the OBV curve sloping downwards; i.e. the market’s selling power still prevails. We are likely to see the OBV start sloping upwards before a reversal of the downtrend is noticeable. We can see bitcoin price testing the $200 support level soon enough, which will decide whether or not today’s price drop will continue.
Conclusion:
Volatility is skyrocketing as stressed traders are pulling the bitcoin price downwards because of impatience and uncertainty. Everything other than the bitcoin price is pointing to the fact that bitcoin’s value is increasing; new bictoin startups are created every day and bitcoin is increasingly creating new jobs and more merchants are accepting bitcoin than ever before. It won’t be until long that we can see the price parallel the real value of bitcoin.
Charts from Bitfinex.