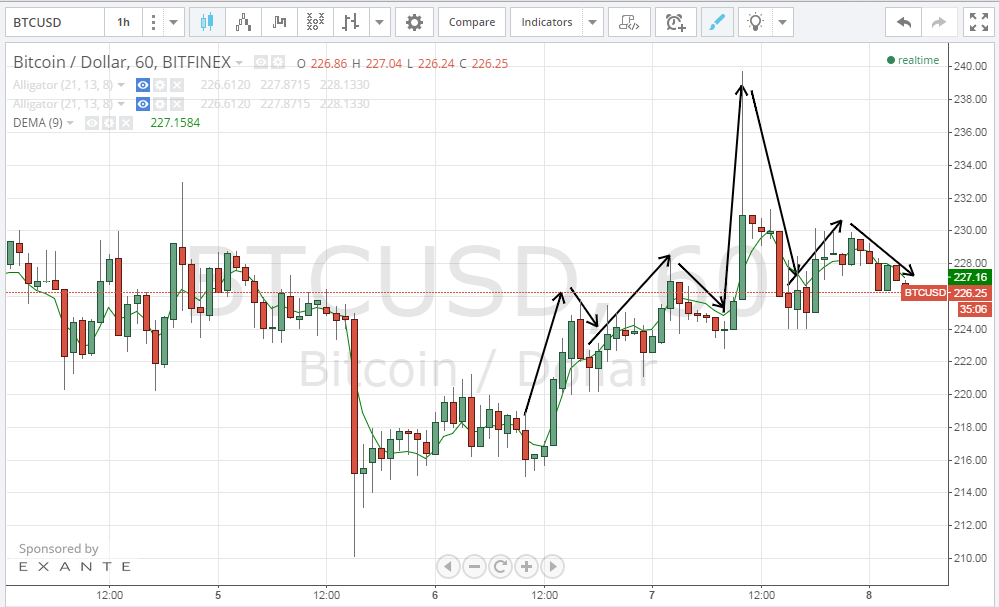
Bitcoin price advanced to around $240 today after we spotted a bullish wave which started yesterday. Today’s bitcoin price increase is highly considerable given the bearish wave that has been dominating the market throughout the past 2 weeks.
By studying the 1 hour Bitfinex (BTC/USD) charts from tradingview.com (look at the below charts), we can notice that today’s trading led to a repetitive pattern of candlesticks; 3-5 green bullish candlesticks followed by 2-3 red bearish candlesticks which is a pattern that has been pushing the price upwards earlier today. Each bullish wave is followed by a shorter bearish retreat which reflects the market’s attempt to correct the price as some traders are closing their long positions to take profit. As per our previous analyses during the past couple of weeks, it’s evident that bitcoin price is going to continue rising, especially since the $200 support level is continuously proving that it is strong enough to prevent the price from falling below it.
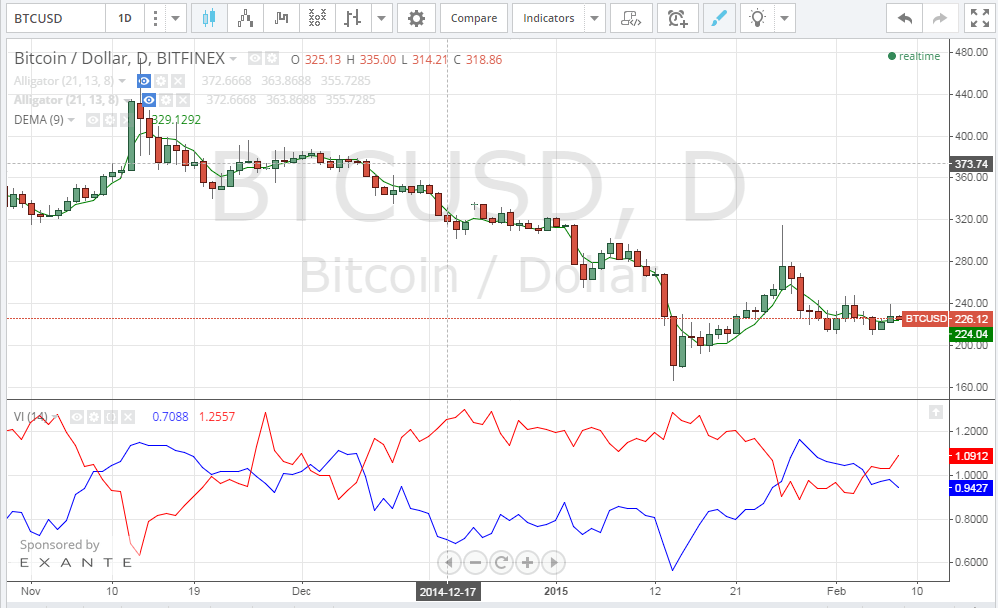
By plotting the Vortex Indicator on the 1 day Bitfinex (BTC/USD) charts from tradingview.com (look at the below chart), we can see that the blue positive trend line is very close to the red negative trend line which signifies a state of “congestion” that will soon yield to a breakout in the upward direction, especially since the $200 support level seems to be rock solid at the moment. A stronger bullish advance is expected soon, but we can expect to see the blue positive trend line crosses above the red negative trend line before a bullish rally is noticeable.
Conclusion:
Bitcoin price continued rising today to score a high of around $240. Technical analysis is in favor of the continuation of this bullish wave during the next few days. It is likely to see the price testing the $256 resistance level soon enough.