Bitcoin price declined a bit today and the long awaited bullish wave was further delayed. The $220 level was tested today and continued to prove that it is currently supporting the price well.
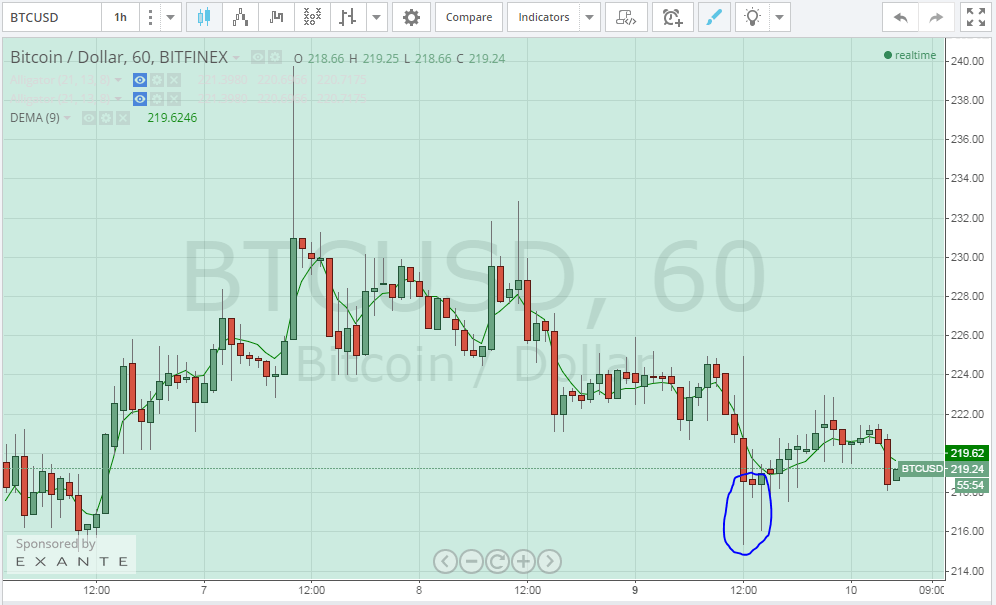
By observing the 1 hour Bitfinex (BTC/USD) charts from tradingview.com (look at the below chart), we can notice that the price dropped today from around $224 to $216, before rising up again to $220. As the price approached the $220 level, support has been prominent as proven by the candlesticks’ long shadows near the $220 territory (look at the 3 candles inside the blue cloud on the below chart). Throughout the past few days, the $220 level has been proving that it can resist a price drop and it also points to the overall psychology of traders who believe that bitcoin price is definitely higher than $220.
By looking through the 1 day Bitfinex (BTC/USD) charts from tradingview.com and plotting the Vortex Indicator (VI) accordingly (look at the below chart), we can notice that today’s trading didn’t exhibit a definable trend and the price can be safely described as moving sideways as the $220 level is approached. The red downtrend line of VI has crossed above the blue uptrend line and the gap between the two lines is rather wide, which means that the chances of a bitcoin price rise is not promising during the upcoming hours; however, we are likely to see the blue uptrend line cross above the red downtrend line before a bullish wave could be witnessed.
Conclusion:
Bitcoin price declined before the $220 support level continued to prove how it is yet strong enough to resist another bearish dive. Analysis proves that a bullish wave can be delayed for a few days.