Bitcoin price started the day by rising from around $236 to more than $248 before a bearish downtrend pulled the price down back to around $226 at the time of the writing of this article. As the price is advancing, it’s logical to see downward price movements as traders take the profit by closing their long positions.
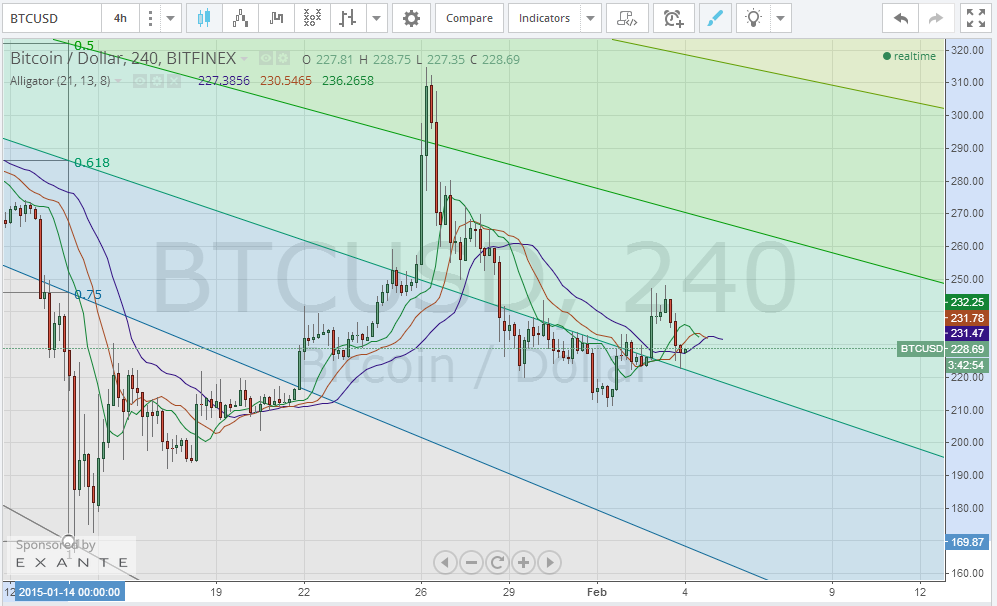
Although the bullish rally slowed down today, it’s quite obvious that bitcoin price won’t break the $200 support level, maybe because of the psychological makeup of the traders who think that a bitcoin is worth more than $200. By plotting the Fibonacci retracement fan on the 1 day Bitfinex (BTC/USD) charts between the high reached on the 13th of November, 2014 ($473.13) and the low reached on the 14th of January, 2015 ($165.82), as we did on our analysis on the 30th of January, and then extending the Fibonacci retracement fan across the 4 hour Bitfinex (BTC/USD) charts (look at the below charts), we can clearly see that bitcoin price is now touching the 62% Fib retracement fan level which will likely resist further decline and will reverse the downtrend, so the price would resume its bullish advance.
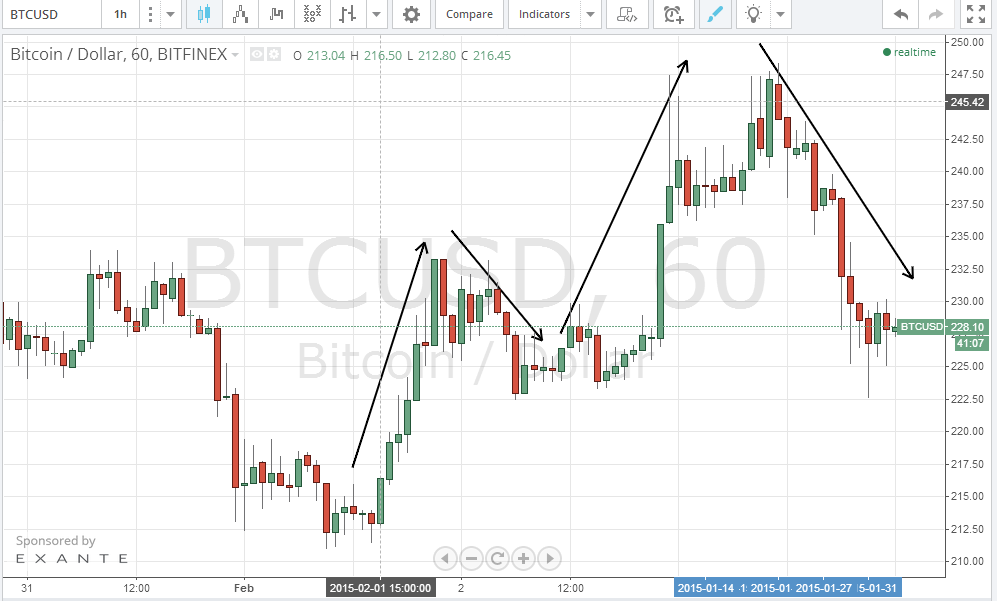
By studying the 1 hour Bitfinex (BTC/USD) charts from tradingview.com, we can notice that each bullish wave is followed by a downward price correction as illustrated by the arrows on the below chart. At the time of writing of this article, the charts are showing candlesticks with long downward shadows, which means that the bitcoin price is resisting further decline and is about to rise shortly.
Conclusion:
Yesterday’s bullish rally was followed today by a downward price correction. Analysis shows that the price will resume rising shortly.
Charts from Bitfinex.