

Bitcoin Price Key Highlights
- Bitcoin price finally made the much-needed correction from its stellar rally, retreating upon hitting the $500 area as predicted in an earlier article.
- Price seems to have already found support at the 61.8% Fibonacci retracement level based on the swing low and high on the 1-hour time frame.
Bitcoin price might be ready to resume its climb from here, potentially heading back up to the previous highs and beyond.
Indicators Support Another Bounce
Technical indicators are suggesting that the bull run could carry on, with the 100 SMA safely above the longer-term 200 SMA. In addition, the short-term moving average successfully held as a dynamic support level, as bitcoin price promptly bounced after testing it as well.
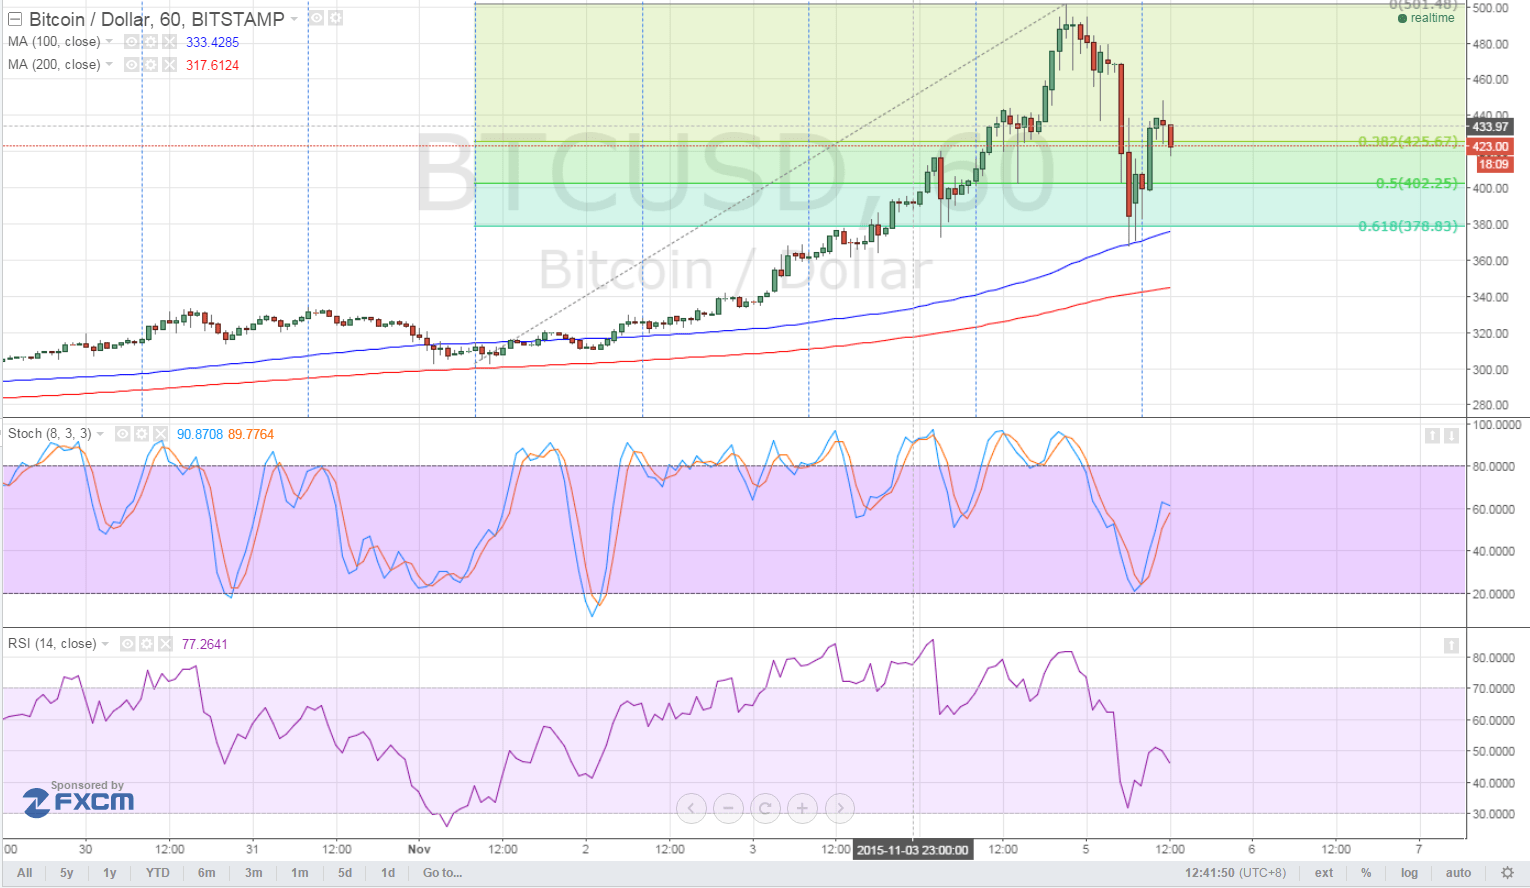

Stochastic is on the move up, confirming that buyers are taking control of bitcoin price action and have enough energy to push for gains once more. Similarly, RSI is also heading out of the oversold area and might be on its way north as well.
The large correction may have been partly spurred by the sharp U.S. dollar rally during yesterday’s New York trading session, as Fed Chairperson Janet Yellen confirmed that a December interest rate hike is on the table. This led to expectations of higher returns for U.S. securities and thereby higher demand, along with a risk-off market environment on speculations of increased borrowing costs weighing on spending and inflation.
Risks to this ongoing bitcoin price rebound include the upcoming non-farm payrolls release, which might also have a strong impact on dollar price action. Stronger than expected results could spur another USD rally, effectively dragging BTCUSD lower, while weak data could lead to a dollar selloff and another bitcoin price surge.
Intraday support level – $375
Intraday resistance level – $500
Technical Indicators Settings:
- 100 SMA and 200 SMA
- Stochastic (8, 3, 3)
- RSI (14)
Charts from TradingView