

Bitcoin Price Key Highlights
- As predicted in an earlier article, bitcoin price enjoyed additional volatility during the release of top-tier jobs data from the US last week.
- Since the actual data came in much stronger than expected and revived hopes of a Fed interest rate hike in December, the US dollar held on to its gains and kept bitcoin price in correction mode.
Bitcoin price could pull back to the lower Fibonacci retracement levels, with technical indicators suggesting that the corrective wave is still in play.
Area of Interest at 61.8% Fib
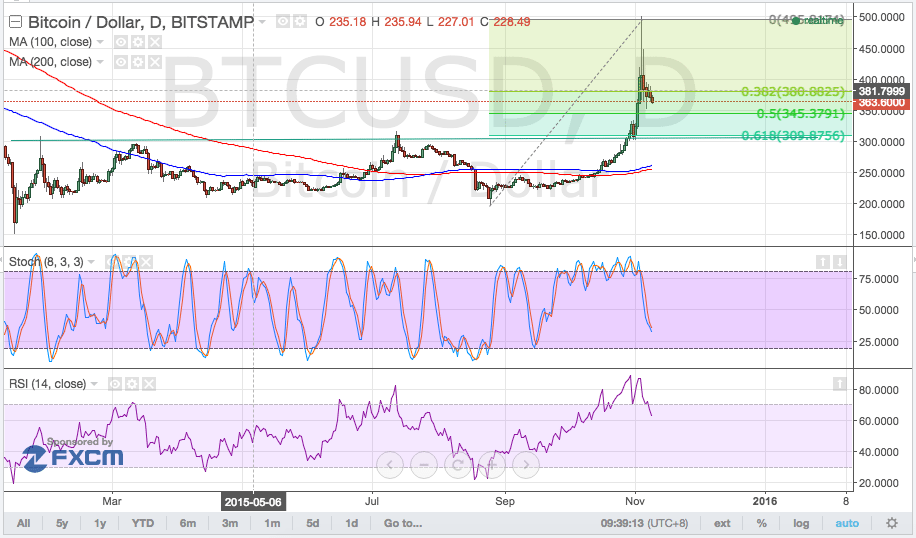
In particular, the 61.8% Fibonacci retracement level coincides with an area of interest or former resistance level around $310. Stochastic is still on the move south, which indicates that sellers are in control of price action. Meanwhile, RSI is just heading down from the overbought zone, reflecting a pickup in bearish pressure.
Note that stochastic is nearing the oversold zone, with buyers ready to hop in once the oscillator turns higher. If that happens sooner rather than later, bitcoin price could already make a bounce off the 38.2% Fib.
The 100 SMA is above the longer-term 200 SMA, which suggests that the path of least resistance is to the upside and that the bull run might resume sooner or later. In that case, bitcoin price can eventually bounce back to its previous highs around $500. However, the short-term moving average is edging close to the 200 SMA, hinting that a downward crossover is possible.

If so, bitcoin price could resume its selloff, with a break below the 61.8% Fib likely to spur a drop to the swing low near $200. Much of this could hinge on US dollar demand, which is likely to stay supported now that the likelihood of a Fed interest rate hike in December has increased considerably.
Intraday support level – $310
Intraday resistance level – $500
Technical indicators settings:
- 100 SMA and 200 SMA
- Stochastic (8, 3, 3)
- RSI (14)
Charts from BitStamp, courtesy of TradingView