

Bitcoin Price Key Highlights
- Bitcoin price has been unable to gain much traction on its previous long-term climb, forming one consolidation pattern after another on its short-term time frames.
- Zooming out to the daily chart reveals that bitcoin price might be contemplating a possible long-term reversal.
- A complex head and shoulders pattern has been completed, with a diagonal neckline right around the current price.
A downside break below the neckline of the head and shoulders pattern could confirm a prolonged selloff for bitcoin price.
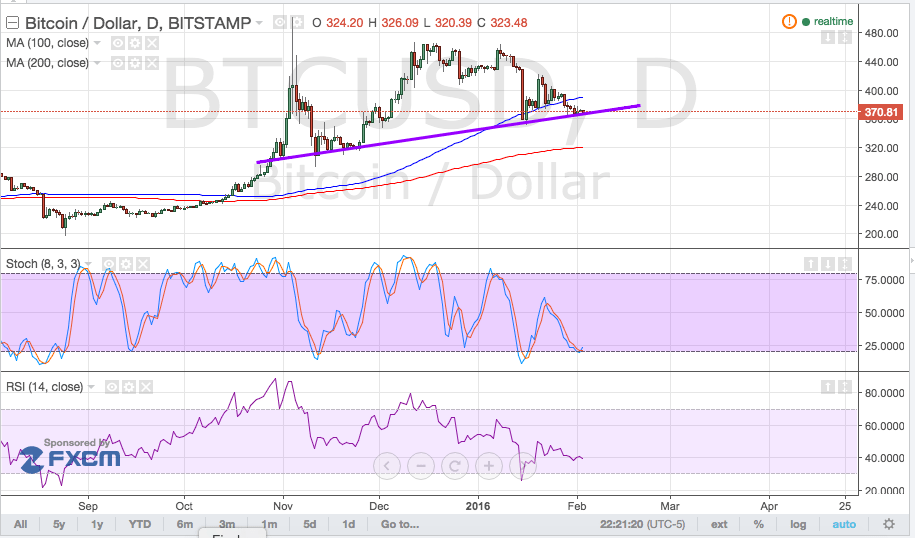
Technical Indicators Signals
The 100 SMA is still above the 200 SMA, which suggests that a bounce off the neckline might be possible. Aside from that, the short-term SMA is moving farther away from the longer-term moving average, showing that buying pressure is strengthening.
Also, stochastic is moving out of the oversold area, which means that buyers might be able to take bitcoin price higher from here. RSI is on middle ground but appears to be on the way up as well.
Depending on market catalysts, however, a downside break might be possible. A long red candle closing below the $350 area could be enough to confirm a long-term drop, which might take bitcoin price to the 200 SMA at $320 or the next major support area at $300.

Market Risks
Risk aversion appears to be driving market action again this week, as the return of oil supply concerns are weighing on higher-yielding assets including bitcoin. The latest report from the American Petroleum Institute showed a buildup of 3.387 million barrels in crude oil inventories while other energy supplies also increased.
The US crude oil inventories report from the Energy Information Administration is due today and another strong gain in stockpiles could keep supply concerns in play. So far, the OPEC hasn’t reached an agreement on whether or not to hold an emergency meeting to discuss production cuts.
Other event risks this week include the NFP report, which might show a weaker hiring gain of 192K for January compared to the previous months. Leading employment indicators have reflected declines, highlighting the likelihood of a downside surprise.
In addition, Fed officials have been sounding more cautious these days, reiterating that they’re keeping closer tabs on inflation data. The core PCE price index showed a flat reading, reflecting subdued price pressures and causing market participants to reduce expectations of a Fed hike in March.
Central Bank Action
Most major central banks appear to be busy adjusting their policies and biases, which suggests that investors might be on the hunt for assets that are not subject to central bank action. This could prop up demand for bitcoin and other alternative currencies, which are more or less driven by market supply and demand.
Then again, depending on the changes in market sentiment, the dollar could still win out since it’s the preferred safe-haven of most economies and large institutions. This ups the odds of a downside break from the head and shoulders pattern in bitcoin price.
Intraday support level – $370
Intraday resistance level – $400
Technical Indicators Settings:
- 100 SMA and 200 SMA
- RSI (14)
- Stochastic (8, 3, 3)
Charts from Bitstamp, courtesy of TradingView