Bitcoin Price Key Highlights
- Bitcoin price is testing the $2000 levels and traders are wondering if it could keep rising past this psychological mark.
- Before this happens, though, bitcoin might need to pull back to nearby support levels to get more buyers to join in.
- A rising trend line can be drawn to connect the latest lows of bitcoin price action on the 4-hour chart.
Bitcoin price might need to make a correction before sustaining its climb past the $2000 mark.
Technical Indicators Signals
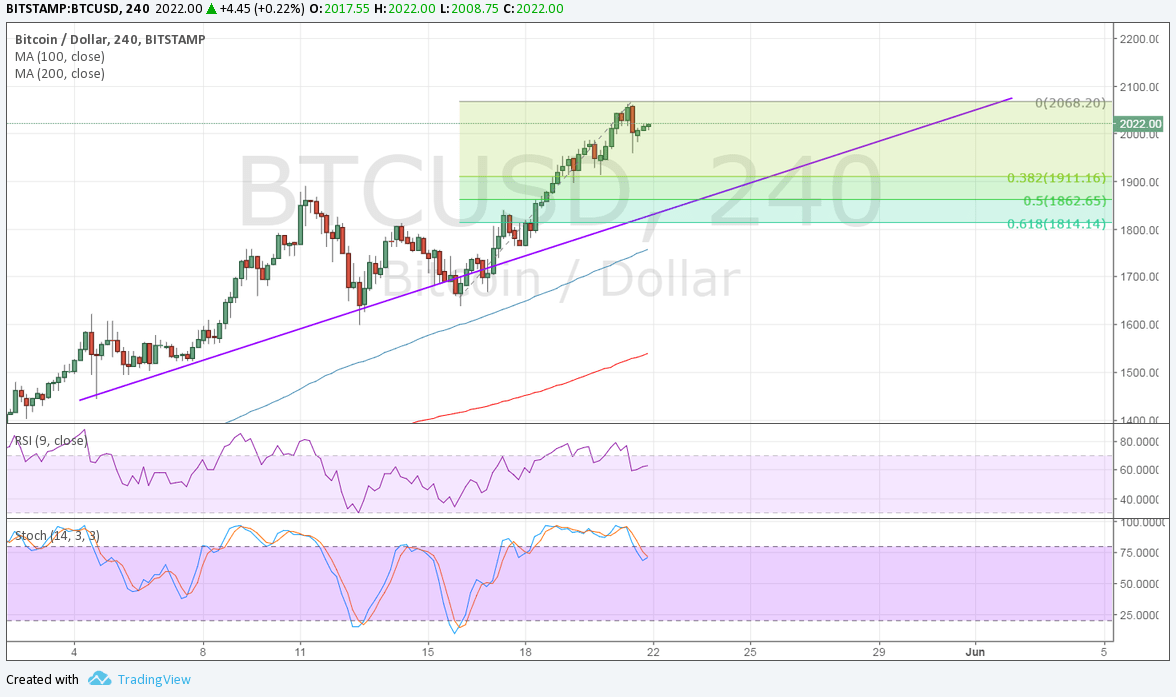
The 100 SMA is above the longer-term 200 SMA so the path of least resistance is to the upside. This short-term moving average is also close to the rising trend line that’s been holding since the start of May, adding to its strength as support.
In addition, applying the Fibonacci retracement tool on the latest swing low and high shows that the 38.2% to 50% levels line up with the trend line and a former resistance area that might now hold as support. If so, bitcoin price could resume its climb past the swing high around $2070 and climb to $2100 next.
RSI is turning lower from the overbought zone to show a return in selling pressure. A bit of divergence can be seen as this oscillator made lower highs since May 10 while price had higher highs then.
Stochastic is also heading south from the overbought zone to show that sellers are taking control of bitcoin price action. Once the oscillator hits the oversold region, buyers could get back in the game.

Market Factors
Rising volumes in Japan are still seen to be the major drivers of the bitcoin price gains, but the increase in geopolitical risk is also sustaining the climb. Last week, the focus has been on the uncertainty generated from the ongoing investigation on Trump’s intelligence information leak to Russian officials.
Apart from spurring demand for non-traditional assets like bitcoin, it has also led to lower demand for the dollar on weakening Fed rate hike expectations for next month and declining US bond yields. Even if the Fed does tighten, the lack of progress on fiscal reform could weigh on the odds of future rate hikes for the year.