Bitcoin Price Key Highlights
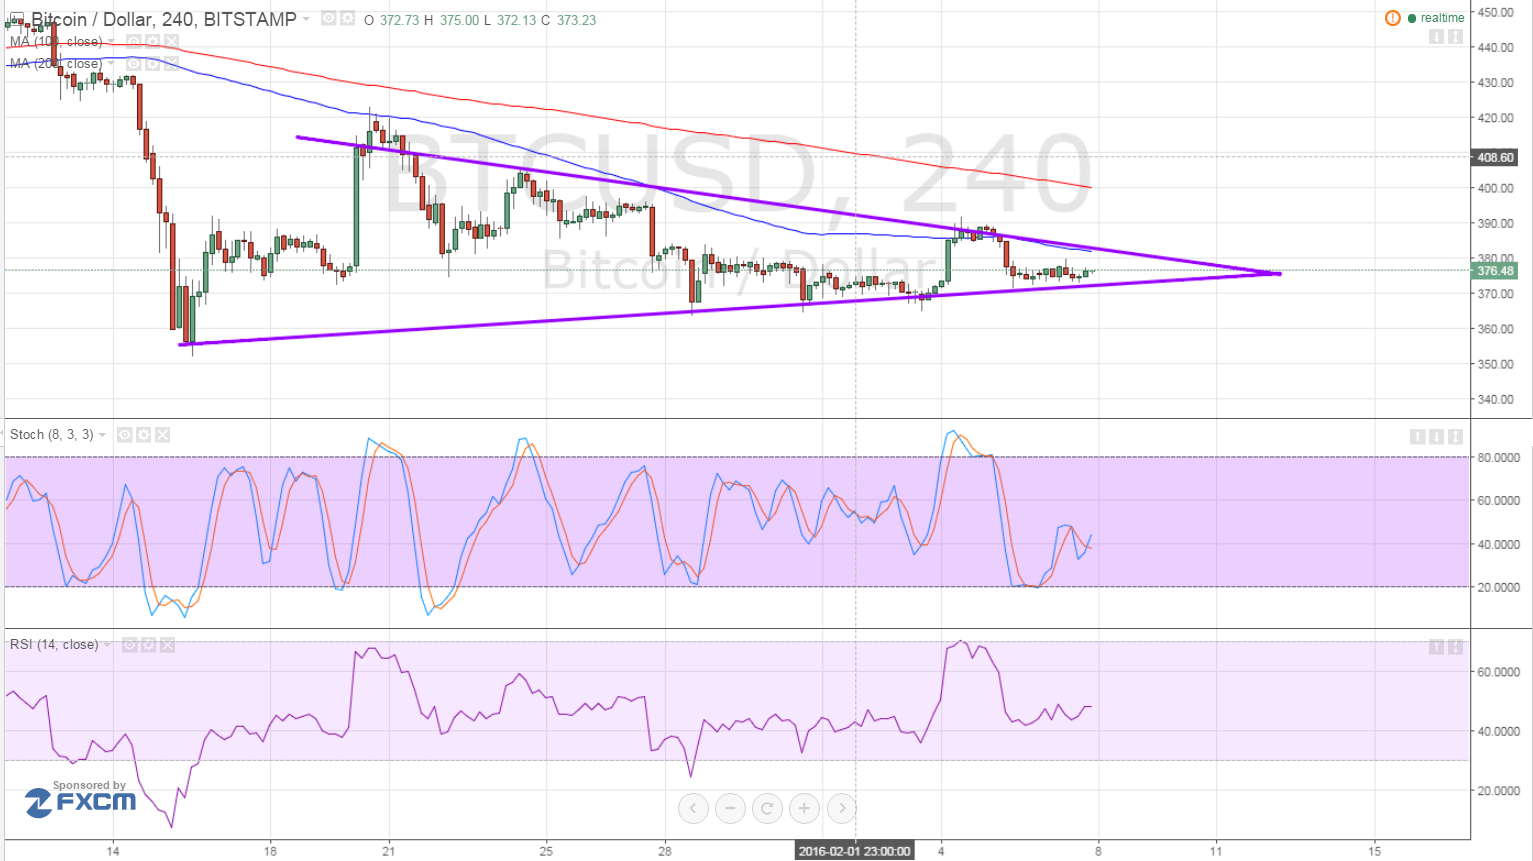
- Bitcoin price has been consolidating on the 4-hour time frame, moving inside a symmetrical triangle pattern with its higher lows and lower highs.
- Bitcoin is coming off a strong downtrend, indicating that there may be some downside momentum left once bears are finished taking a break.
- Price is testing the bottom of the triangle consolidation pattern right now so a quick bounce to the top might be possible.
Bitcoin price could test the top of the triangle, which might hold as resistance since it coincides with the 100 SMA and is coming off a strong downtrend.
Technical Indicators Signals
The 100 SMA is below the longer-term 200 SMA so the path of least resistance is to the downside. This suggests that the $390-400 area might keep gains in check, pushing bitcoin price back to the bottom of the triangle at $370-375.
Stochastic is on its way up, after just making it out of the oversold region. This indicates that bullish pressure is present and that buyers could attempt to push past the triangle resistance. If so, price could test the 200 SMA dynamic inflection point at $410 next.
RSI is on the move down but appears to be treading sideways at the moment. This could reflect indecision for both buyers and sellers, as traders wait for more market clues.

Market Events
The US NFP report printed weaker than expected results, as the economy added only 151K jobs in January. Still, the unemployment rate fell to its nine-year low of 4.9% while the participation rate improved. Also, average hourly earnings rose 0.5% versus projections of a 0.3% uptick.
There are no reports out of the US economy today and Chinese banks are closed for the holidays, indicating quiet trading during the Asian sessions. Also risk sentiment could be on the cautious end for now, which suggests that further consolidation could be possible.
Up ahead, there are no major reports lined up for the rest of the week so traders might also take cues from commodity prices. So far, oil prices have gained support on speculations that an OPEC special meeting is in order. Any indication of a possible production cut could send commodities higher and boost bitcoin price, which typically rises when risk-on flows are seen.
Potential Breakout?
A breakout in either direction could push bitcoin price on a strong trend. Note that the triangle pattern is around $70 in height so a resulting breakout could lead to the same amount of gains or losses.
A move past the $400 level could take bitcoin price up to $470 while a break below the triangle support at $370 could yield losses until $300. Watch out for a long green candle closing above the triangle resistance before going long and a long red candle close below support before shorting.
Intraday support level – $370
Intraday resistance level – $400
Technical Indicators Settings:
- 100 SMA and 200 SMA
- RSI (14)
- Stochastic (8, 3, 3)
Charts from Bitstamp, courtesy of TradingView