Bitcoin Price Key Highlights
- Bitcoin’s price could be in for more gains, as technical indicators on the short-term time frames are hinting at a pickup in bullish pressure.
- A steeper trend line can be drawn to connect the latest lows of Bitcoin price action on the 1-hour chart, and a quick bounce took place on the latest test.
Bitcoin price might be aiming for the yearly highs around $500 since it broke above another consolidation pattern as expected.
Bullish Divergence Materializing
The stochastic oscillator has formed lower lows from the start of the month to yesterday while Bitcoin prices made higher lows, adding confirmation that buyers are gaining control of the game. In addition, the 100 SMA is moving farther away from the longer-term 200 SMA to indicate stronger bullish momentum.
In fact, the 100 SMA lines up with the rising trend line and may hold as a dynamic support zone in case another pullback occurs. A larger correction to the 200 SMA at the $380 level might be possible, and this might still hold as a floor since it lines up with a longer-term rising trend line.
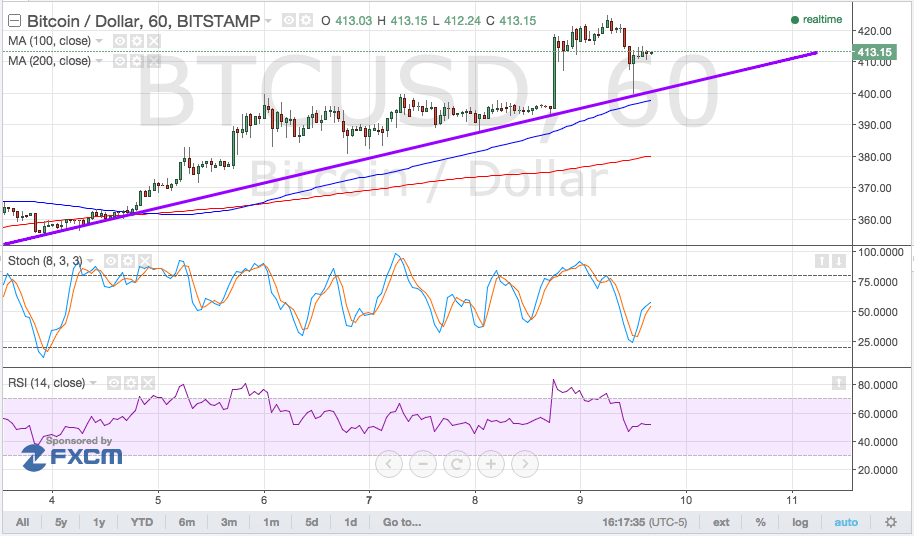

The stochastic oscillator is already on the move up, which means that sellers are taking a break and letting buyers take control. However, RSI is on middle ground and appears to be on its way down, which means that there’s a bit of selling pressure left.
Still, if the Bitcoin price is able to make a break past the latest highs at the $420 area, it could be on track towards surging up to the $500 resistance level, which was tested a few weeks back. Several take-profit levels may be located in that area, which suggests that it’s likely to hold as a ceiling, especially since the end of the year is approaching.
Intraday support level – $400
Intraday resistance level – $425
Charts from Bitstamp, courtesy of TradingView