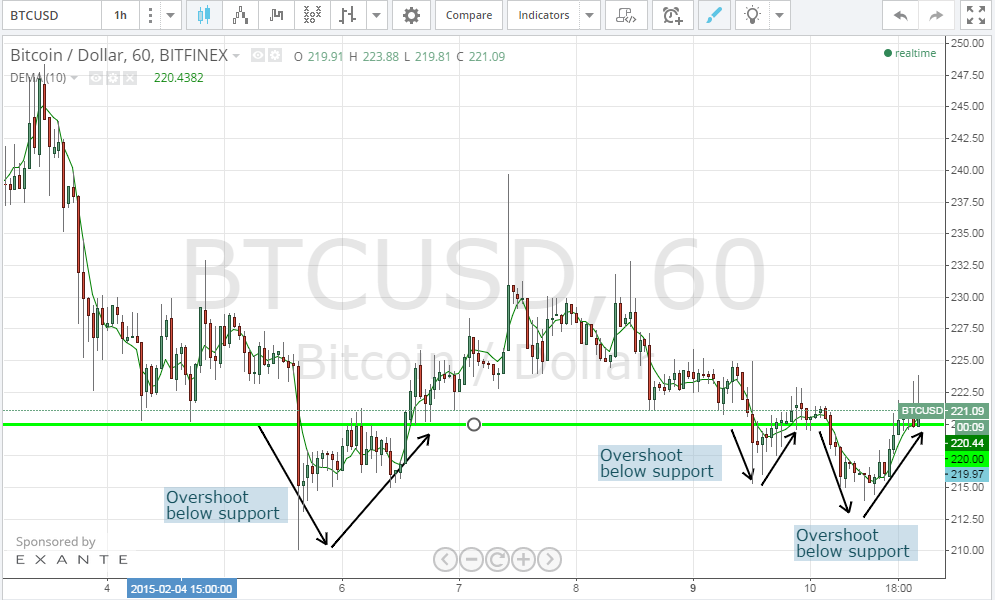
Bitcoin price fell slightly below the $220 support level to score a low of $214 before rising up again to $221.71 at the time of my writing of this article. Bitcoin price overshot below the $220 support level; yet, it rapidly corrected itself to rise above $220 during later trading sessions.
By looking through the 1 hour (BTC/USD) Bitfinex charts from tradingview.com (look at the below chart), we can notice how the price dropped to $214 yet the downtrend was reversed a few hours later and pushed the price above the $220 support level. As shown on the below chart, we can see how bitcoin price overshot below the $220 support level, before rising up again above $220 three times during the past 5 days. This signifies the strength of support at the $220 level and further endorses the fact that we are not likely to see bitcoin price drop below $220 during the upcoming few days, especially considering that bitcoin is now trading above its 10 day EMA. Today’s price drop could be attributed to the Mycoin crisis news reaching more mainstream news sources and wider news audiences.
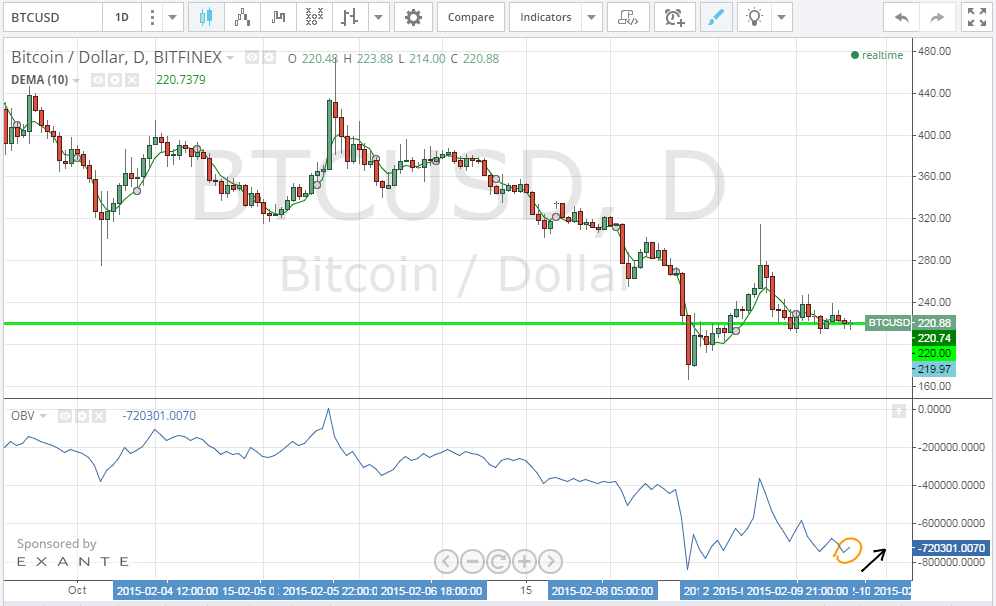
By studying the 1 day Bitfinex (BTC/USD) charts from tradingview.com and plotting the On-Balance Volume (OBV) oscillator accordingly (look at the below chart), we can notice that the OBV curve has just started to slope in an upward direction today, which points to an increase in the market’s buying pressure. A volume increase always precedes a rise in price, so an upwards sloping OBV signals an upcoming rise in bitcoin price.
Conclusion:
Bitcoin price overshot below $220 before rapidly correcting back above this seemingly rock solid support level. Long trade positions can be confidently executed at an entry price of $220 with a take profit around $256.
Charts from Bitfinex